How Can You Create Pinnable Content If You’re Not a Visual Brand?


Former VP of Marketing @ Buffer
As we’ve started to dig in on the best way to connect with our audience on Pinterest, we came across an interesting question: How can we best create visual content for Pinners to Pin?
We’re not in one of the top niches for Pinning: food and drink, crafts, home decor.
How can we make sure that every blog post we write is as Pinnable as possible?
It’s been a fun experiment to see what’s worked. I’ll be happy to share with you some of the best practices we dug up with our research and how any brand—no matter the niche or visual orientation—can succeed in creating Pinnable content.
What makes for the best Pinnable images
We’ve found that the best Pinnable images have one (or more) of the following elements:
- Vertical (portrait) orientation
- At least 600 pixels wide, with 736 pixels being optimal
- Aspect ratio of 2:3 or 1:3.5
- Up to three separate images in a mosaic
- Text overlay on the image
- Rich, descriptive alt text (more on this below)
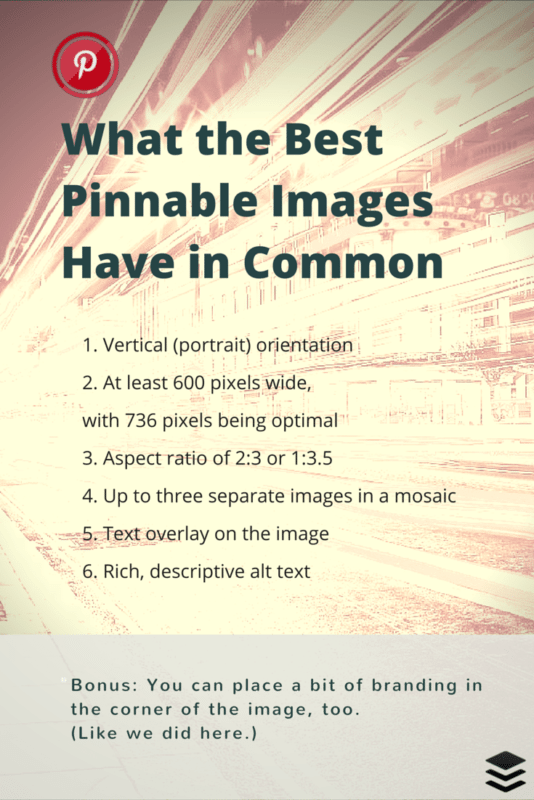
Bonus: You can place a bit of branding in the corner of the image, too. (Like we did in the image above.)
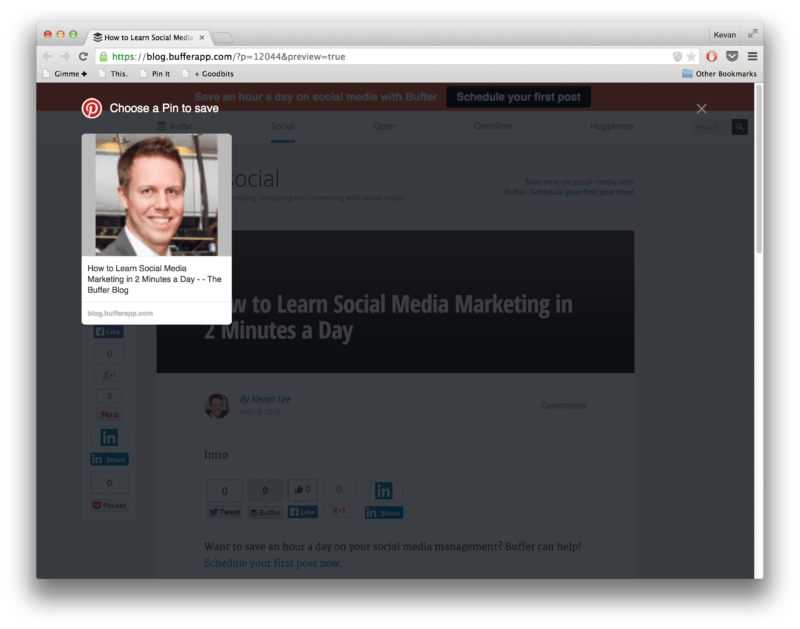
The big challenge we’re eager to solve is how you can get your pages to be Pinterest-ready when a visitor wishes to share to Pinterest.
For instance, what do your visitors see when they use the Pinterest browser extension on your site?
Do they see this?
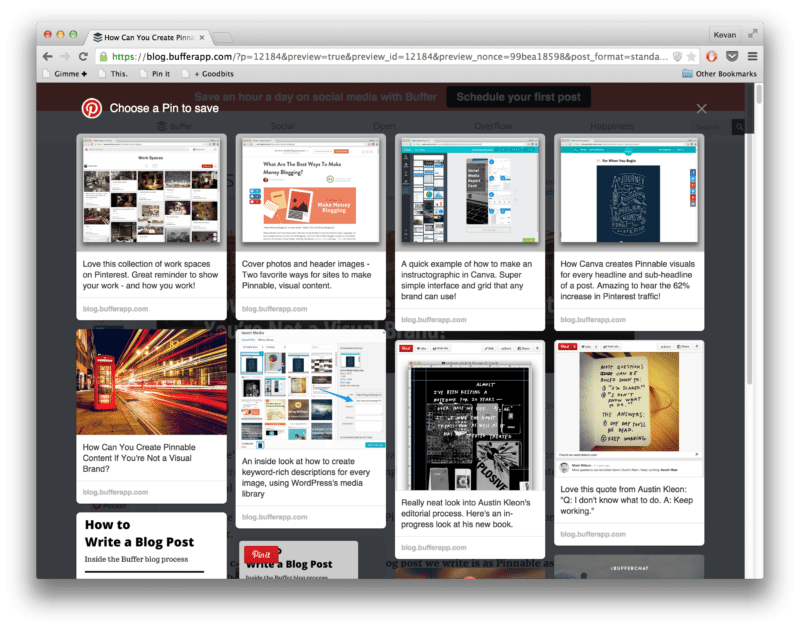
Or this?
Here are seven ideas on how to design your pages and blog posts in such a way that they’re Pinnable and visual, no matter your niche.
1. Add a cover image
One thing that every blog post has, no matter the niche or topic, is a headline.
A headline is a visual waiting to happen.
This might be the most common way to add a visual component to your content. It’s a tactic you’ll find at blogs like Rebekah Radice, CoSchedule, Get Spokal, and many more of the most influential blogs out there.

We try to create these for Buffer blog posts, too. Our formula:
Keyword Phrase + Subhead + Icon + Stock Photo = Pin-worthy Image
You can mix together a number of different elements to come up with yours:
- Headline
- Subhead
- Keywords
- Stock photo
- Icon
- Background pattern
- Background color
- Your logo
As far as placement goes, we like to put ours just after the introduction and the “more” tag. Some bloggers put it ahead of the introduction. You can definitely toy around with this to find the spot that fits best.
Another consideration: Size.
We’ve built our cover images at a 2:1 aspect ratio, which is optimized for Twitter and Facebook but doesn’t quite take full advantage of Pinterest’s layout.
You can see how other bloggers have gone with Pinterest-sized images instead. These take up a bit more scroll depth in the post; coincidentally, many studies have found that there is no harm in placing things well below the scroll.
2. Build an infographic
One of the strongest pieces of visual content you’ll find is the infographic.
And infographics work across a huge number of niches and topics.
For inspiration, you can do a search for “infographics” on Pinterest and discover some really neat boards. Aly Juma, for instance, has pinned infographics about psychology, vegetable growing, data science, and vacation planning, just to name a few.
So how do you go about building an infographic for your content?
We’ve had the opportunity to try out a couple different methods here at the Buffer blog. The first is partnering with a designer to build us a custom graphic. We teamed up with designers at SumAll on a collaborative infographic that both of us could share.
If you’ve got a design-minded friend or a neighbor blog that could assist you, this could be a great route to try. Also, you can find help on Visual.ly or Fiverr.
Second, we’ve experimented with building our own infographics using some helpful, free tools. Courtney made a Pinterest infographic for launch, using Piktochart. Many of the free tools listed below allow you to build a complete infographic by embedding charts, photos, and more. You can get started with a prebuilt template (and then customize yourself) or you can go truly bare bones and build the entire infographic however you see fit.
3. Create an instructographic
The instructographic = An infographic of instructions.
When browsing Pitnerest, you might see a lot of instructographics for DIY house projects, crafts, or recipes.
And really, you could create one for just about any How To post you write.
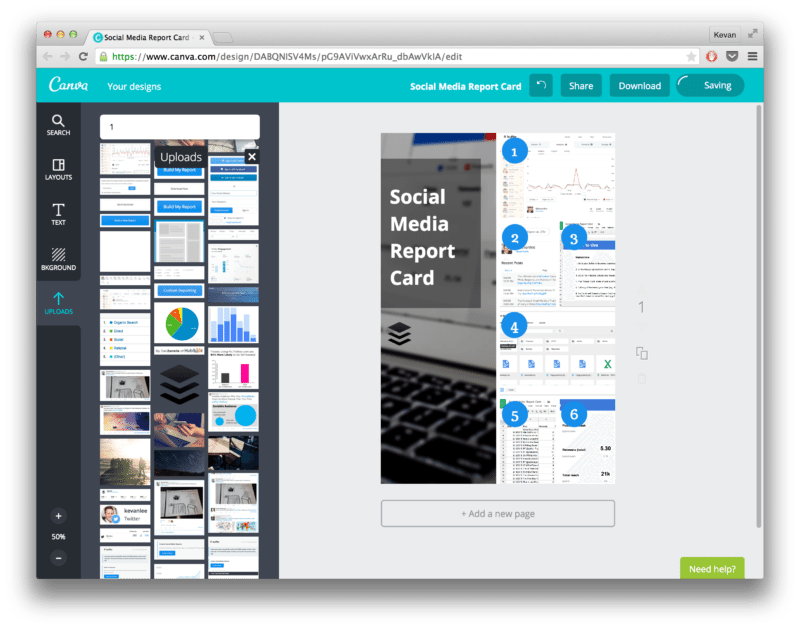
Take, for instance, a recent How To we put together on building a social media report card (maybe not the most visual concept that comes to mind). These were the steps involved in creating the report card:
- Download a copy of our free Report Card spreadsheet and add to your Google Drive.
- Export analytics from your Buffer dashboard.
- Import the data into the Google spreadsheet.
- Adjust any headings or titles to fit your style. The rest of the data is pulled in automatically!
To build the instructographic, we could have taken screengrabs of some of the main steps here and placed them together using a Canva mosaic. Voila! Instructographic!
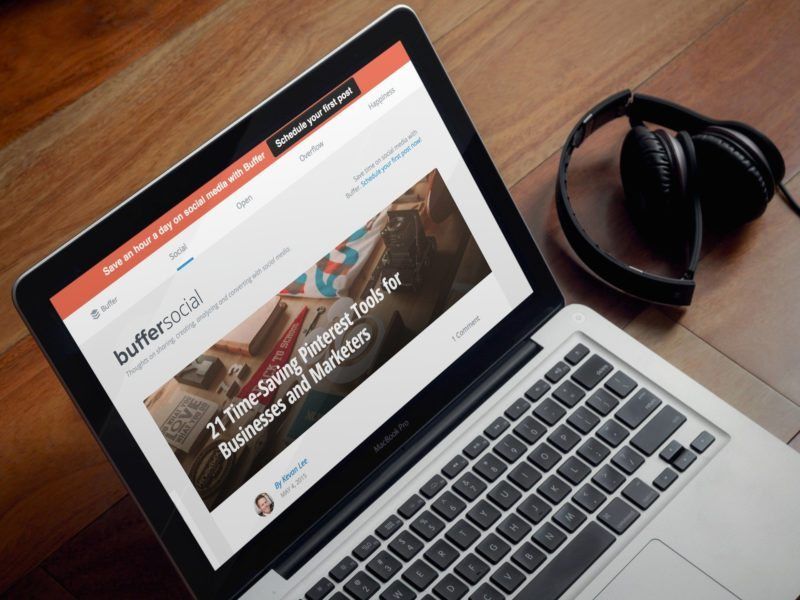
Bonus tip: If you find you’d like to share a screenshot, one way to add a bit of visual flair is to drop the screenshot into a PlaceIt template. You can choose from any device or orientation, set in a number of professional stock photos and backgrounds. Here’s an example of a quick one from the Buffer blog:
4. Share photos of your process
If you scroll through Pinterest, you’ll see a good share of photography. In fact, photography is one of the most popular categories for men on Pinterest, according to a study from the University of Minnesota and Georgia Tech. And photography’s influence is a big factor in the visual attention of categories like food and drink, home decor, and fashion.
All this focus on photography naturally leads to opportunities to take pictures of what you’re doing.
Author Austin Kleon has made a living this way, sharing pictures of his notebooks and works-in-progress.
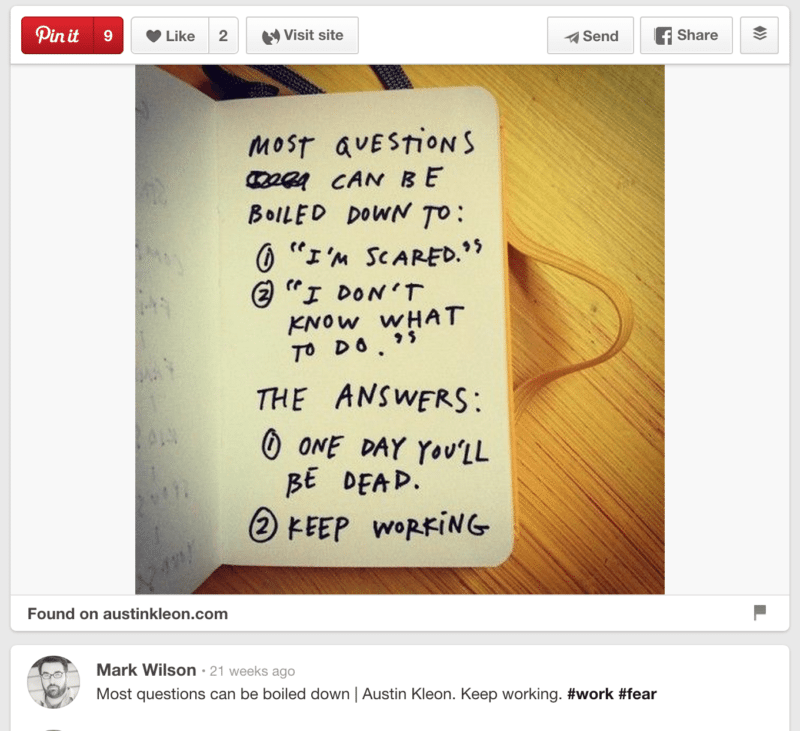
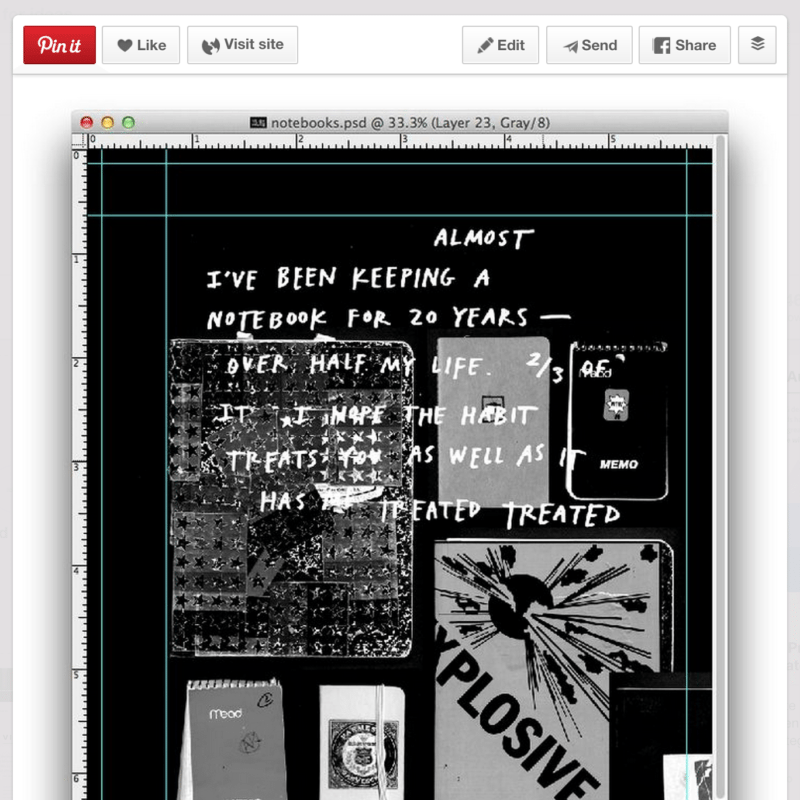
If it makes sense to include in your blog post a photo of your process—perhaps a picture of your doing a step in a How To, or your sharing an early drawing of a first version of something—these are great opportunities for visuals.
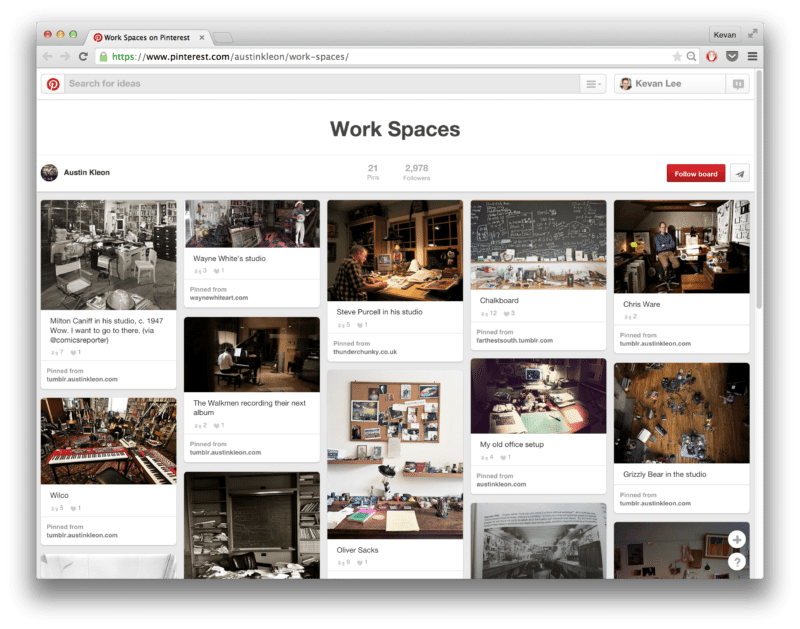
For a good example, you can look at Copyblogger’s interview series about how famous writers write. Each post includes a picture of the writer’s space. These images make for great, Pinnable content.
5. Highlight quotables, blockquotes, and snippets
Another common denominator in many articles is the presence of quotes or memorable one-liners or cool sections of research that deserve highlighting.
These make for great opportunities to create Pinnable content.
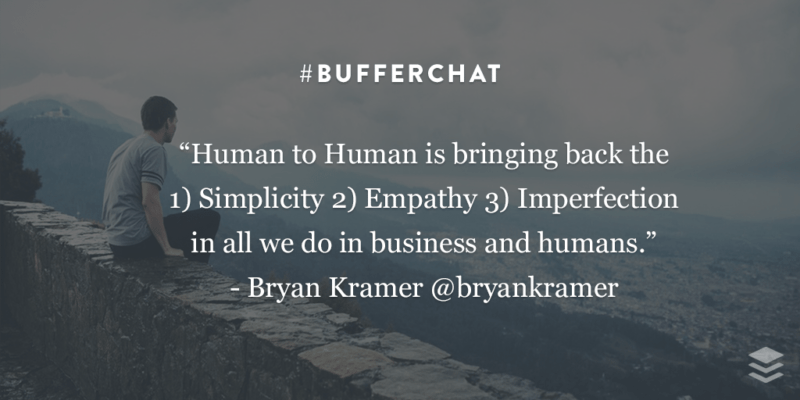
One of our favorite ways to create these visuals is using Pablo, which lets you go from text to image in 30 seconds or less.
- Copy and paste your desired text into Pablo’s text box.
- Add a byline or a logo to the image
- Choose the font you like best
- Choose a background image (you can blur the image, too, for a cool effect)
- Download and add to your blog post
We’ve found that these have been a useful addition to the #bufferchat recap posts that we publish every week. In lieu of other visuals, we’ve been able to create some nice images to go along with these posts and give readers something to share and Pin.
6. Make an image for every headline
Here’s a Pinterest tip that Andrianes Pinantoan at Canva provided us. Although Canva is very visual, any type of brand can steal this secret—and even use Canva to help pull it off!
Instead of one feature image (the norm), place one under every sub-headline and for every point you make. Since doing this at the Canva blog, they’ve seen Pinterest traffic increase 62.5%.
Want to see this concept in action? Check out this post, which got 1.3k shares on Pinterest alone.
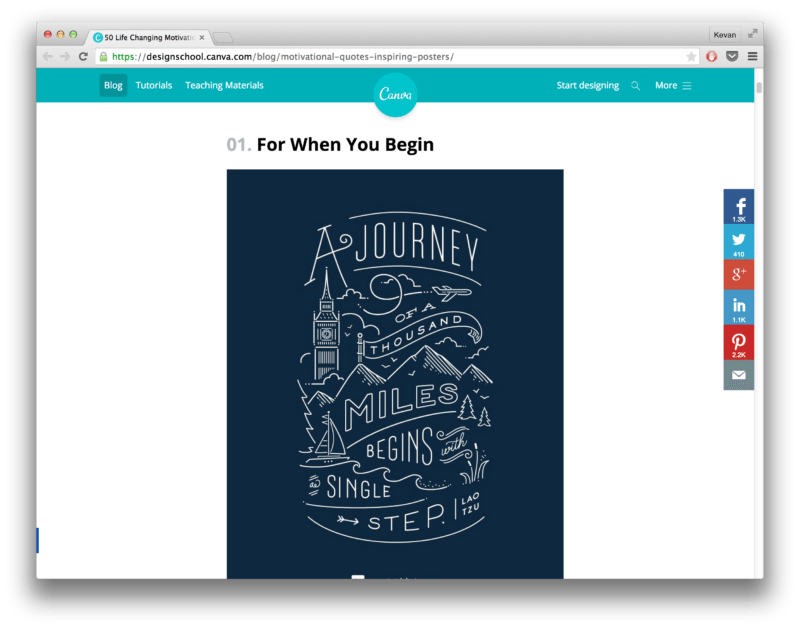
You can also see which types of images get pinned from Canva’s Design School site – you’ll notice the overwhelming majority of images are graphics from within posts.
If your industry lends well to curation like Canva’s, then curate some awesome images for your posts. Or you can, of course, create awesome custom images with Canva and other free image-editing tools.Using templates is an amazingly efficient and effective way to boost the amount of visual content you can use.
7. Include stats, charts, and graphs
If you’re writing a blog post that includes any numbers—our posts tend to include research and statistics, for instance—you can quickly put these figures into a Pinnable image.
What we look for with Pinnable numbers are those that lend themselves well to charts and graphs.
- Pie charts
- Bar charts
- Line charts
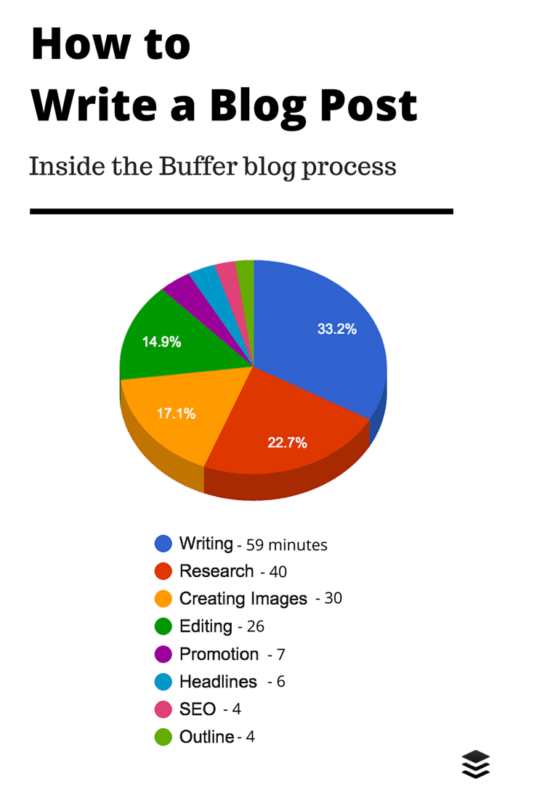
One of our most recent examples of this was a blog post about how we spend our time writing Buffer blog posts. The three-hour total divided easily into a pie chart that we could use as a Pinnable image.
How might you go about making visuals like these?
Our quick tip (and the one that we used above) is to build the charts in Google Sheets or Excel. The full workflow goes a little like this:
- Add the numbers to a Google spreadsheet
- Select your data and click the “Insert chart…” button
- Design and format the chart as you’d like
- Take a screengrab of the chart
- Put the screengrab into a Pinterest-sized template at Canva
Once in Canva, you can add any additional text, backgrounds, or design elements that feel best. And the finished product slots right in as a helpful, Pinnable visual for your blog post.
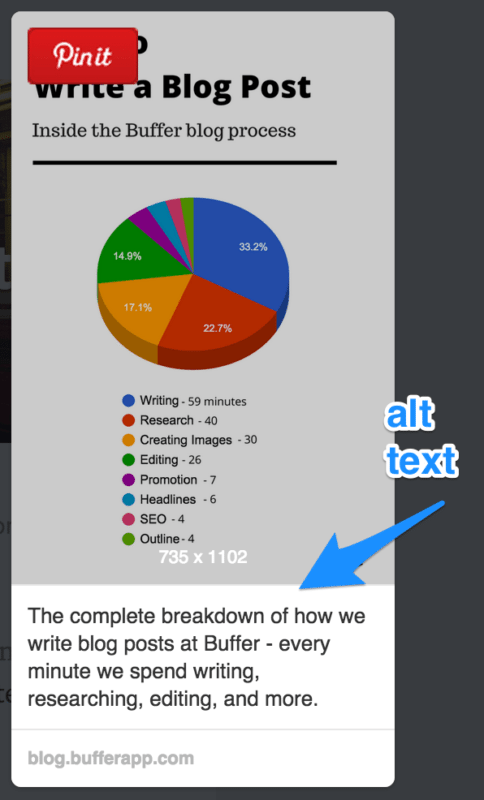
Bonus tip: Add rich, descriptive alt text
Not only can you help out those who want to Pin from your site by including great visuals, you can go the extra mile by suggesting some keyword-rich, contextual descriptions.
To do so, simply add your description into the alt text of your image.
When someone Pins from your page, the description for each potential Pin gets populated from each image’s alt text.
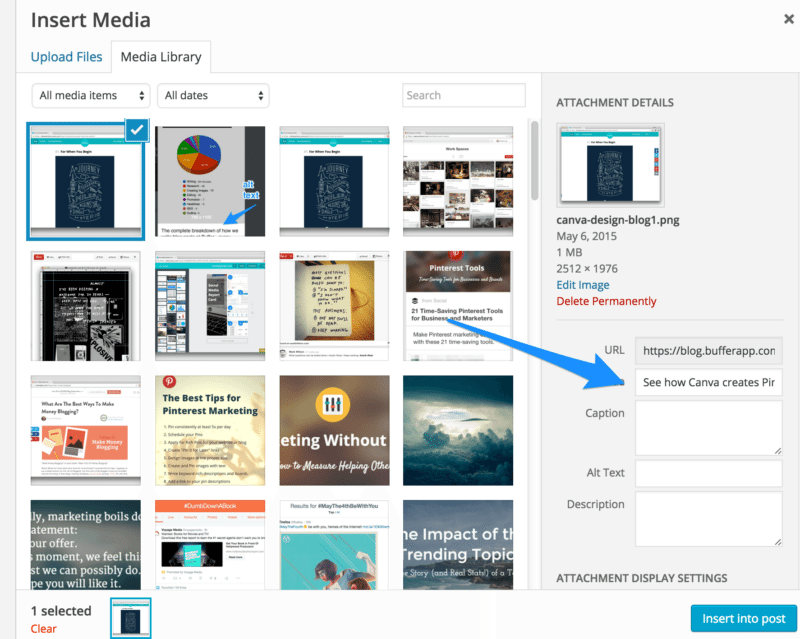
We use WordPress to write our blog posts here at Buffer, and WordPress has the alt text option built right into the media library. When you upload a new image, you can edit the alt text right from the editor. The alt text can be found in the “Title” field here:
Alternately, you can add and edit alt text manually by working with the HTML code of the page. Inside the image tag, add an “alt” attribute with your desired text.
<img src="http://yoursite.com/image.jpg" alt="Your description here." />
Summary
We like to think that it’s possible for any brand—visual or not—to create amazing, Pinnable content. We’re working to improve in this area and to get in the visual mindset for the content we create. Here are our seven top strategies:
- Cover images
- Infographics
- Instructographics
- Photos of your process
- Quotes and snippets
- Images for every headline
- Stats, charts, and graphs
Bonus: Add rich, descriptive alt text to each image
So far, we’ve seen an uptick in Pinterest engagement by focusing on making great images. We’d love for you to experience the same!
What strategies have you found most helpful in creating Pinnable images for your content? Which ones from this list have you tried or might you be eager to try? It’d be great to hear your experience!
Image sources: Pablo, IconFinder, Unsplash
Try Buffer for free
140,000+ small businesses like yours use Buffer to build their brand on social media every month
Get started nowRelated Articles

If you always feel like you’re chasing the tail-end of audio trends on the app, you’ve come to the right place. In this article, I’ll guide you through all the methods you can use to find the most popular music and sounds on Instagram before they drop off the charts.

All the features on Bluesky, plus how to use them.
I put Meta Verified — and the coveted blue check — under the microscope for two weeks. The results were definitely not what I expected.