


Given 140 characters, how can you make the absolute most of every single word, hashtag, and link in a tweet?
We’ve been excited to test and experiment with answering that question by trying out headline ideas, power words, psychology, science, and more.
Now we’re happy to share the quantitative numbers—based on 1 million tweets from Buffer users—about what seems to drive the most clicks, retweets, and engagement on Twitter!
tl;dr
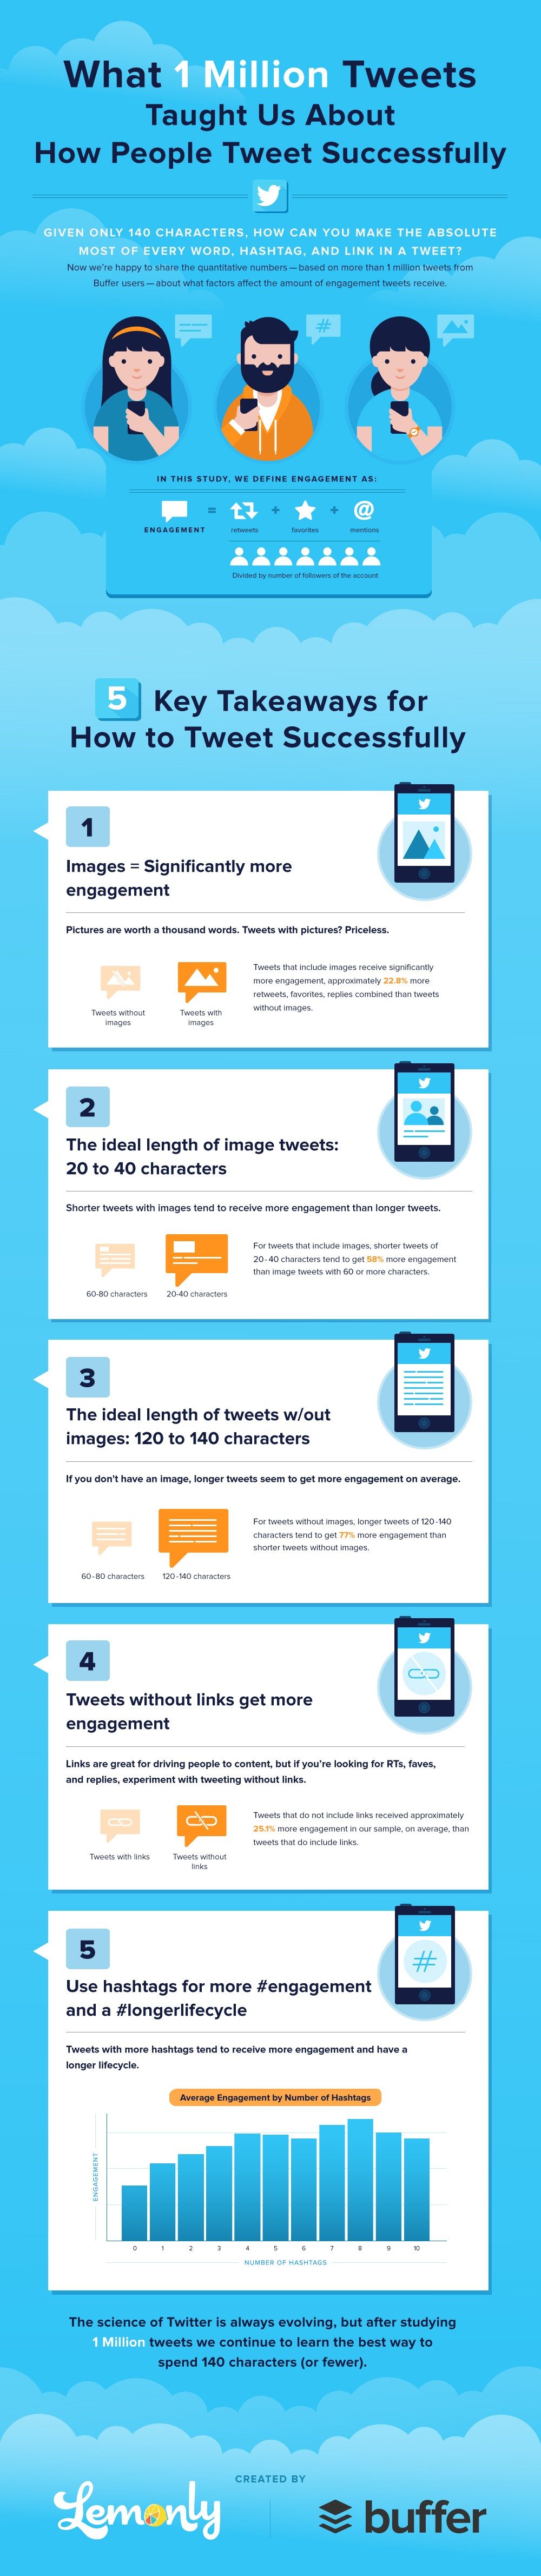
The top takeaways from Buffer’s study on ideal tweets
We’ll dive deep into all the Twitter data and findings below. Up top, I’d love to share the overall takeaways that we discovered when looking at the success of Buffer users on Twitter.
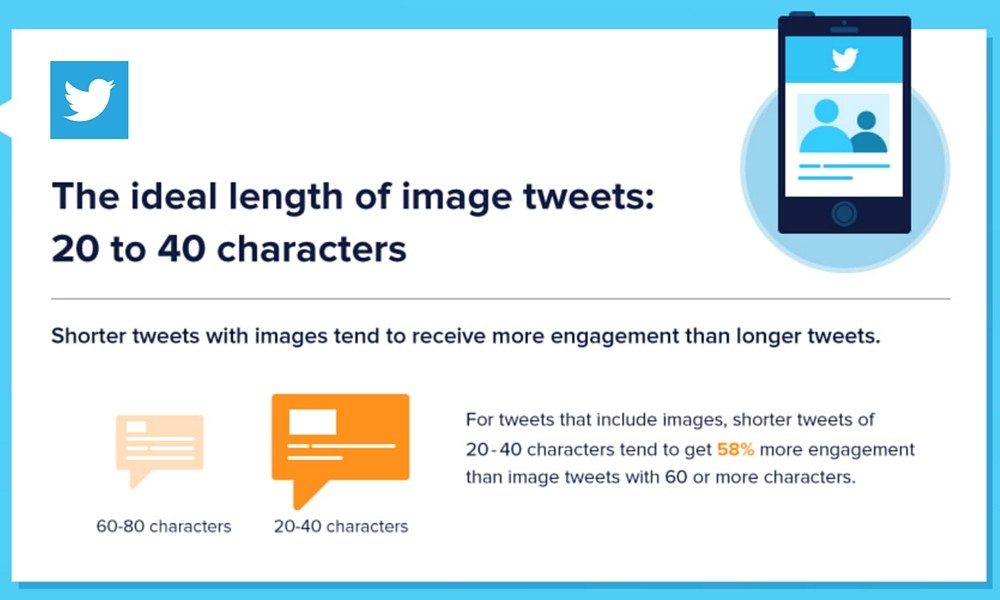
- For tweets with images, shorter tweets of 20 to 40 characters did best
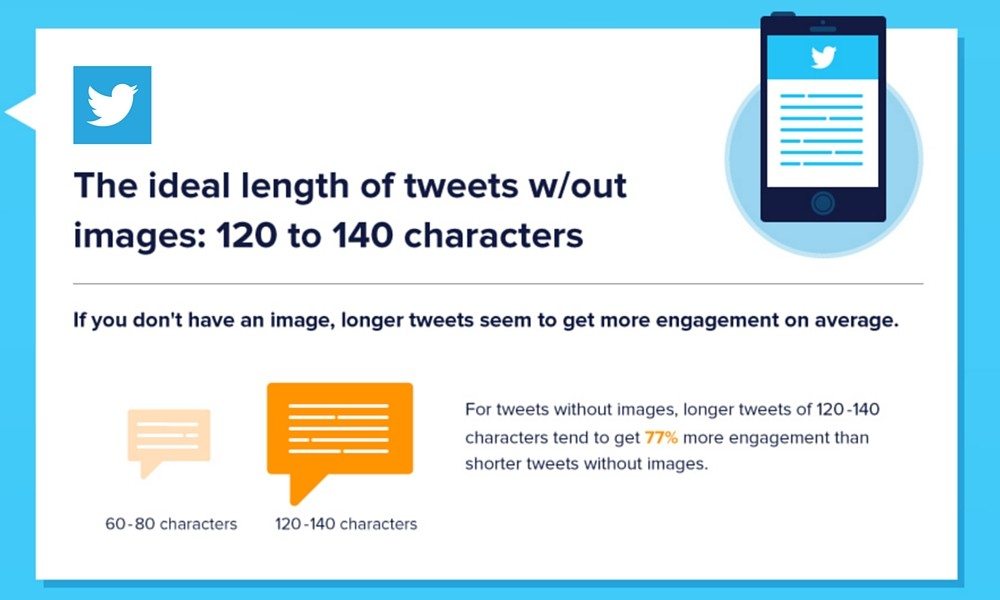
- For tweets without images, longer tweets of 120 to 140 characters did best
- The most popular tweet length was 110 to 120 characters
- Tweets with images received more engagement than tweets without images
- Tweets
links got more retweets, favorites, and replies than tweets with links
- Engagement for tweets with hashtags seems to rise steadily all the way to 4 hashtags per tweet.
We are so grateful to have partnered with Lemonly on creating the infographics and charts for this research. Here’s the beautiful design the Lemonly team came up with:
Share this Image On Your Site
<p><strong>Please include attribution to Buffer with this graphic.</strong></p><br /><br> <p><a href=’https://buffer.com/resources/twitter-data-1-million-tweets’><img src=’/content/images/resources/wp-content/uploads/2015/10/Buffer-Lemonly-twitter-stats-infographic.jpg’ alt=’How to Tweet Successfully’ width=’800px’ border=’0′ /></a></p><br /><br> <p>
See below for more detail on each of these findings.
A note about engagement and data
In this study, we define engagement as the sum of retweets, favorites, and mentions divided by the number of followers of the account.
We chose to exclude clicks from our engagement measure because clicks were only recorded for tweets that included links (around 70% of the dataset), and we wanted to be careful to not skew the effects of our independent variables by giving so much weight to the link factor.
The dataset includes more than 1 million tweets sent between February 1 and February 17, 2015, in the Pacific time zone. (Toward the end of the article, I’ll share some of the limitations and caveats that a dataset like this might entail.)
Now to the results…
How long are the most engaged tweets?
What the data says about tweet length and engagement
You may have heard that the best practice regarding the length of a tweet is to use 100 to 120 characters, plenty long to get your message across while leaving room for others to add their own comments when retweeting you.
As Twitter has evolved, we were curious to find out if that recommendation still holds true.
From looking at the Twitter data, we noticed a couple of interesting trends:
- For tweets with images, shorter tweets tend to receive more engagement.
- For tweets without images, longer tweets tend to receive more engagement.
(We defined engagement as the sum of retweets, favorites, and mentions, divided by followers. We excluded clicks from engagement as the data included both tweets with links and tweets without.)
For overall tweet engagement by length—regardless of whether a tweet had an image or not—we looked at the results from all 1 million+ of the tweets we analyzed.
(This scatterplot chart shows the relationship between engagement per follower and character count, and the blue line running through the data is a smoother, to better visualize the relationship between tweet length and engagement per follower.)
You might notice here that although there seems to be a slight rise in engagement when the character count is less than 40 or greater than 120, the increase isn’t significant enough to quite warrant a claim that tweets with less than 40 characters are best.
In terms of raw numbers, tweets with 20 to 40 characters get around 60 percent more engagement per follower than tweets in the 60- to 80-character range.
We’re a bit hesitant to fully claim that 20 to 40 characters leads to more engaged tweets, due to a number of extraneous factors that could be influencing engagement also. For instance, one of the most significant factors to consider here is how many of these shorter tweets include an image. And it’s possible that fewer tweets have these shorter character lengths so the averages are more volatile.
So how many characters do tweets usually have?
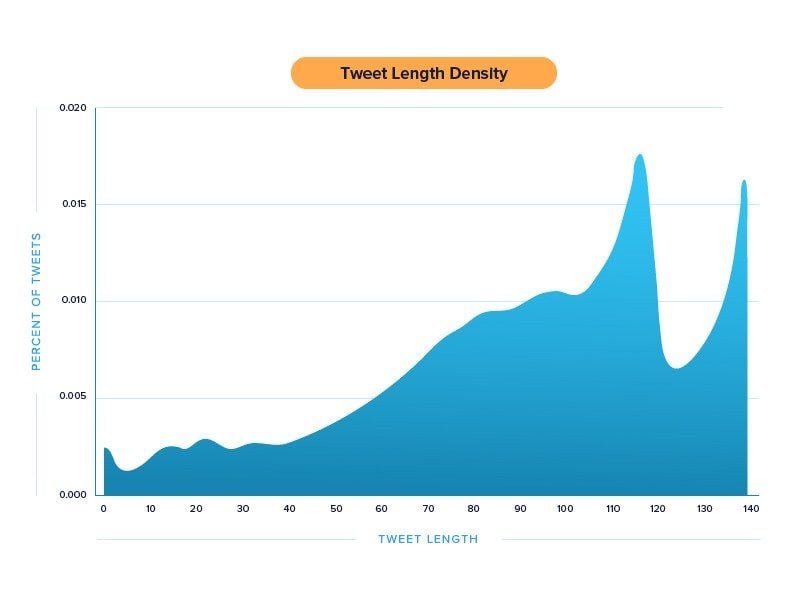
Generally-speaking, most tweets are 80 characters or more.
From our Twitter data, the volume of tweets started rising steadily just after the 40-character length, and the volume peaked between 110 and 120 characters (the long-held idea for best length), with another spike just below the 140-character limit.
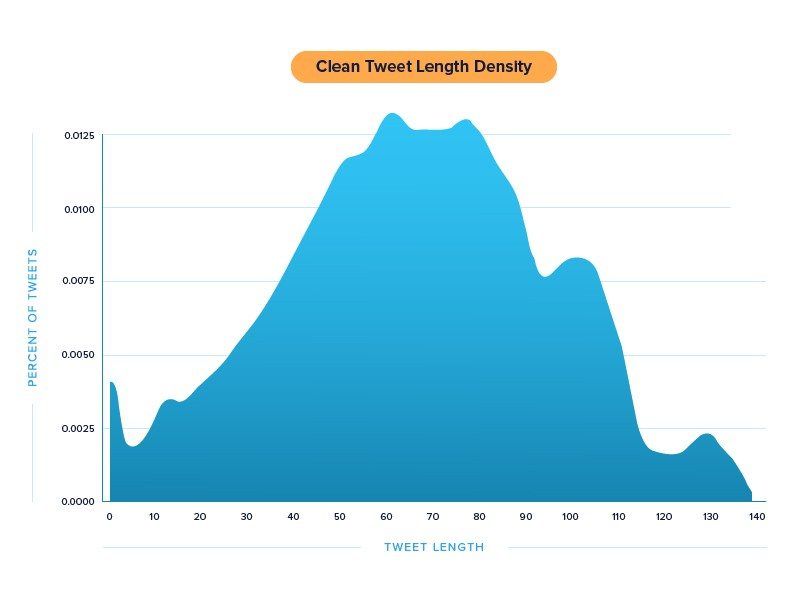
In another look, we cleaned the text field by removing hashtags, punctuation, URLs, and empty whitespace. We thought this might help better represent the true message of a tweet, minus the branded/business elements.
After cleaning the text we can see that the character count is more normally distributed around 60 to 80 characters.
Our best ideas about what this means
The first thought that comes to mind:
There are many factors that might influence the amount of engagement a tweet gets (e.g. sentiment, tone, multimedia, etc.). It can be tough to say if one tweet length is better than another, so we definitely recommend testing and seeing what works for your tweets.
To try to get a sense of what else might be affecting engagement, we can look at the top performing tweets where engagement tends to be higher in the data above.
Top Tweets by engagement per follower
Here’s a list of some of the top tweets we found in the study (and a thought or two on what makes these great).
Possibly the world's greatest pie chart. pic.twitter.com/C4AZW9WeBF
— Ink Tank (@InkTankMedia) May 16, 2015
What’s great about this: A fantastic, funny image that acts as the focal point of the tweet (the update text here amounts to a really great caption).
When you're playing wii, but then you have to go sing in the Super Bowl pic.twitter.com/orb1ml8aFZ
— Dory (@Dory) February 2, 2015
What’s great about this: The content is timely (our Twitter analysis was pulled during February, which included the Super Bowl), entertaining, and visual. Again, like above, the image and the text go together to make the joke. ?
This golden retriever GIF is a straight up daymaker. pic.twitter.com/38bOO7wtyt
— The Animal GIFs (@TheAnimaIGifs) February 5, 2015
What’s great about this: Dogs! The subject matter probably helped quite a bit. It’s also benefitting from the animated image and the funny factor.
And here’s a quick chart of all the top tweets:

My first thought when looking at the top tweets here is that almost all of the tweets include images! The number of tweets that included links (12) wasn’t too different from the number that did (8), but 18 out of 20 of the top tweets included a photo.
Which brings us to …
How does including an image affect engagement?
One of our favorite Twitter tips is to include images with your tweets. We’ve noticed a significant increase—sometimes as much as 150 percent more retweets—when we’ve tried this with our @buffer Twitter account.
Does this advice hold true for all users?
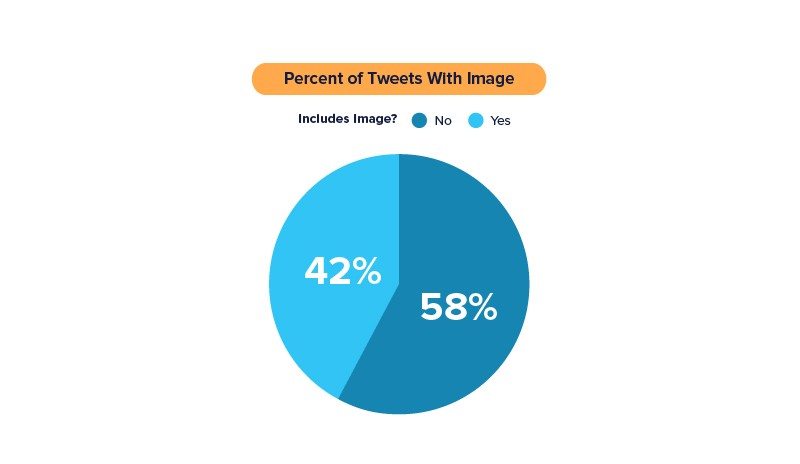
In our dataset of roughly 1 million tweets, around 42% of tweets included an image and roughly 58% did not.
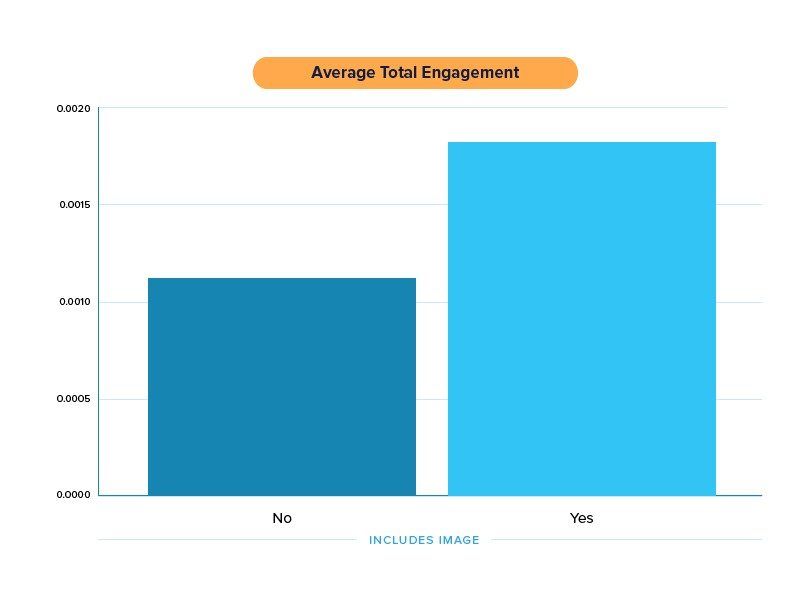
How did the amount of engagement compare for tweets that included images and tweets that did not?
Tweets with images consistently received more engagement than tweets without images.
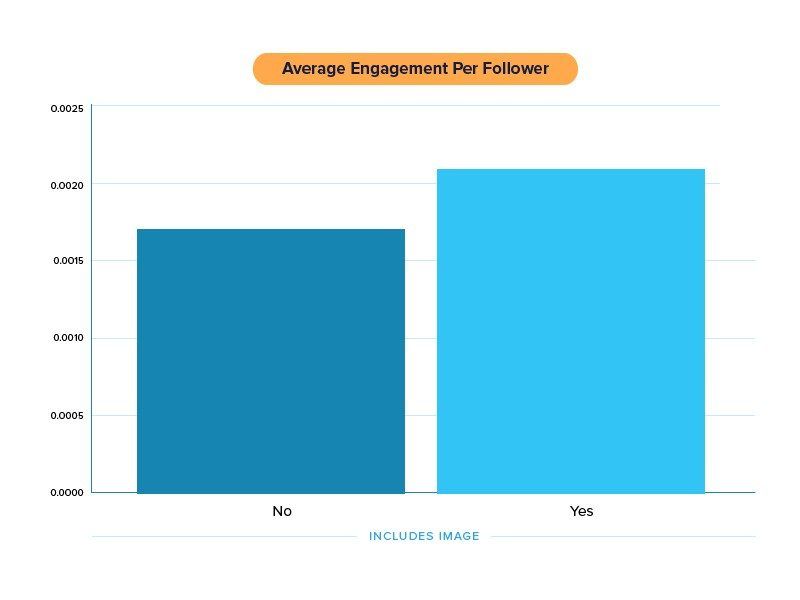
The above chart looks at engagement per follower, which is a way to analyze the data comparatively for those with tons of followers and those with less.
Tweets with images receive approximately 22.8% more engagement than tweets without.
We also ran the higher-level numbers here on average engagement in total. It’s possible that the stats here could possibly be skewed by bigger accounts or outlier results, though in this case, the charts seem to tell the same story – and maybe even to a slightly greater degree – as the one above.
Does including a link mean more engagement?
We know that including a link leads to more clicks (as there’s nothing to click without the link). But what is the effect on retweets, favorites, and mentions?
We found: Tweets with links tend to receive
lessengagement than tweets without links.
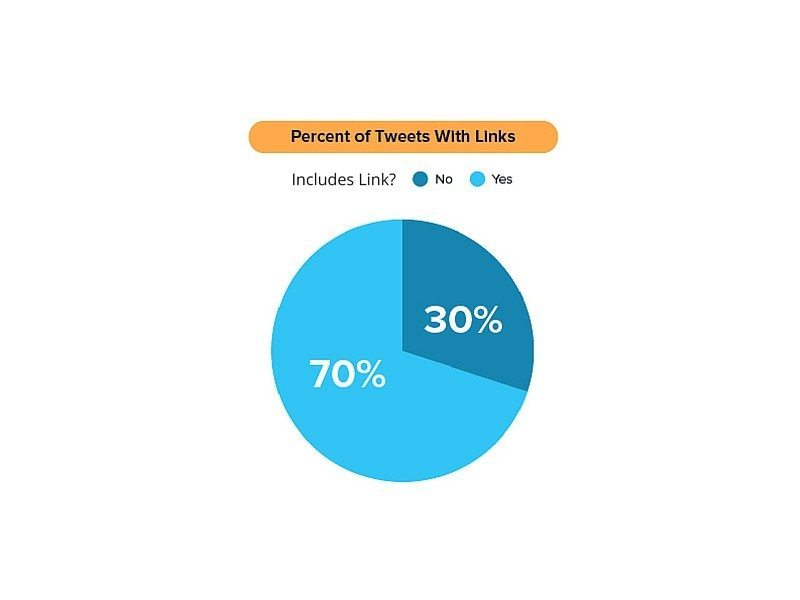
Around 70% of tweets in our dataset included a link, and the remaining 30% did not.
What does engagement per follower look like for these two types of tweets?
Tweets that do not include links received approximately 25.1% more engagement, on average, than tweets that did include links.
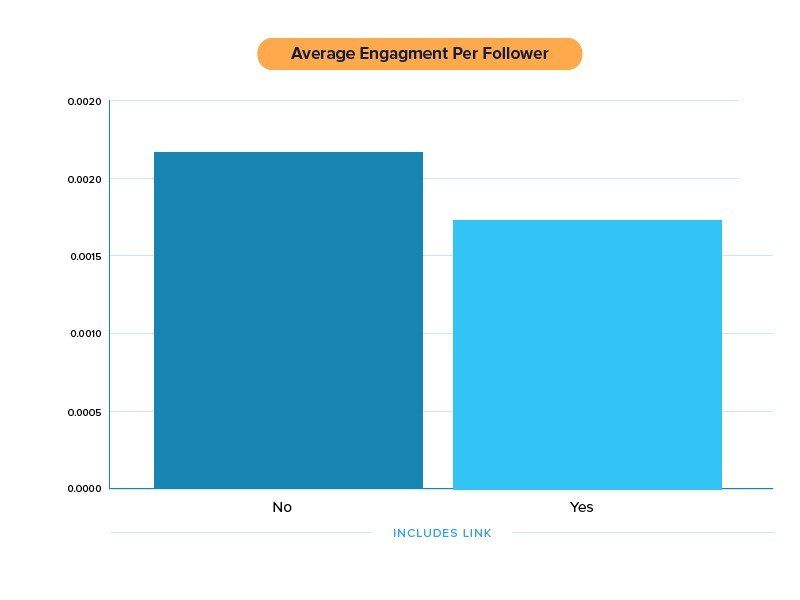
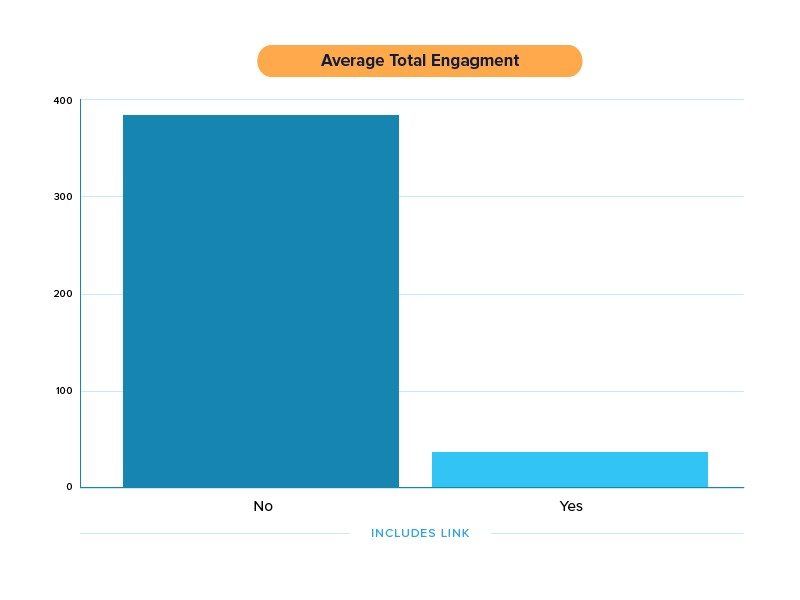
The average engagement per follower suggests that tweets without links tend to receive more engagement, and just in case you were wondering about what the average of total engagement looked like:
Our best ideas about what this means
Seems a bit counterintuitive, right? Tweets without links get more favorites, retweets, and replies than tweets with links.
I was fortunate to have the eyes of my Buffer teammate Tom on this data, and he had a really great thought as to what might be afoot here.
My hunch is it could be partly related to how behavior differs across various Twitter accounts.
I have a feeling that businesses and brands might use Twitter moreso to promote external content through the use of links while personal accounts might be more conversation-focused.
Thinking how this might work on Facebook, for instance, if a company with 1,000 followers posts out a promotional link, it might get 10-15 likes while a personal post to 600 friends might get 50-100 likes.
We took this idea and explored a bit further. What is the breakdown of tweets with links vs. tweets without links, based on different follower tiers?
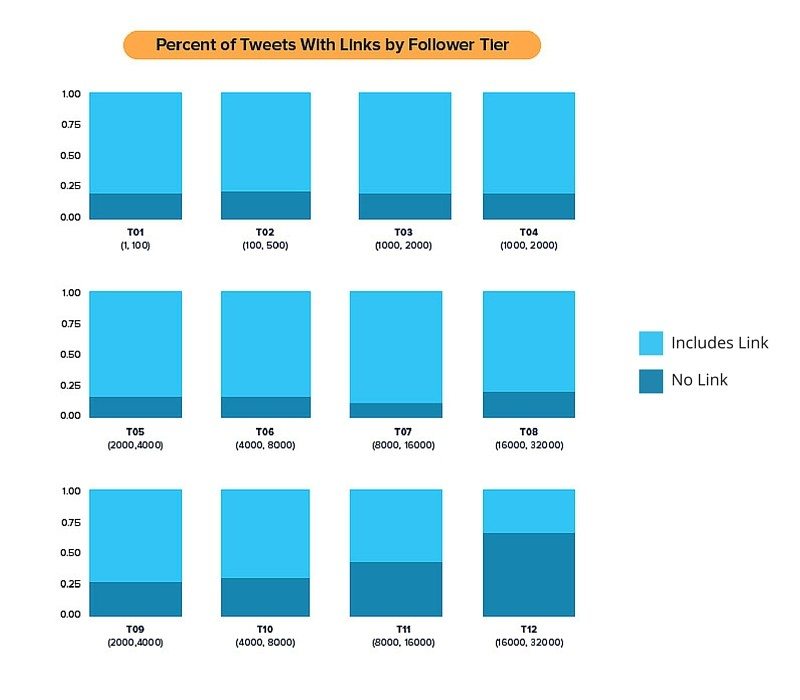
It’s really fascinating that large accounts do post links in the vast majority of their tweets (around 70-80% of all tweets for accounts with up to 16,000 followers), yet the huge accounts—16,000 followers and up—post a relatively large amount of tweets without links!
Could it be that some of the huge accounts are having more conversations than smaller accounts?
It’s an interesting theory and a good reminder that the data we’ve explored here includes everything from everyone who shares with Buffer—both brands and individuals.
A couple extra thoughts:
- Should brands start composing tweets without links? It’d be a good test to try. My best guess is that there’s likely a lot of factors that would be hard to predict. For example, are people less likely to engage with a conversational tweet because it’s from a business vs. from a friend?
- It might also be interesting to mention that tweets with images were less likely to contain links than tweets without images. Since we learned from the earlier takeaway that image tweets get great engagement, it’s possible that images could play a big role in the engagement effect of tweets with or without links, too.
Can including a hashtag improve the amount of engagement you get?
We’ve mentioned in past articles that hashtags help your tweets. We’ve highly encouraged you to give them a try.
Does our new data support this?
Yes!
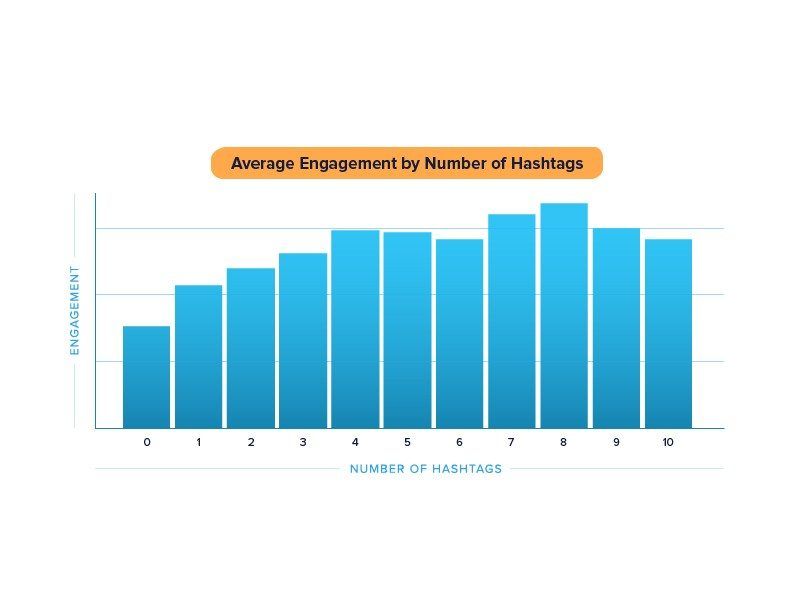
This plot below shows the average amount of engagement per follower for tweets by the number of hashtags included. It’s fascinating to see a clear positive relationship here. The positive effects of adding more hashtags seems to rise steadily all the way to 4 hashtags per tweet.
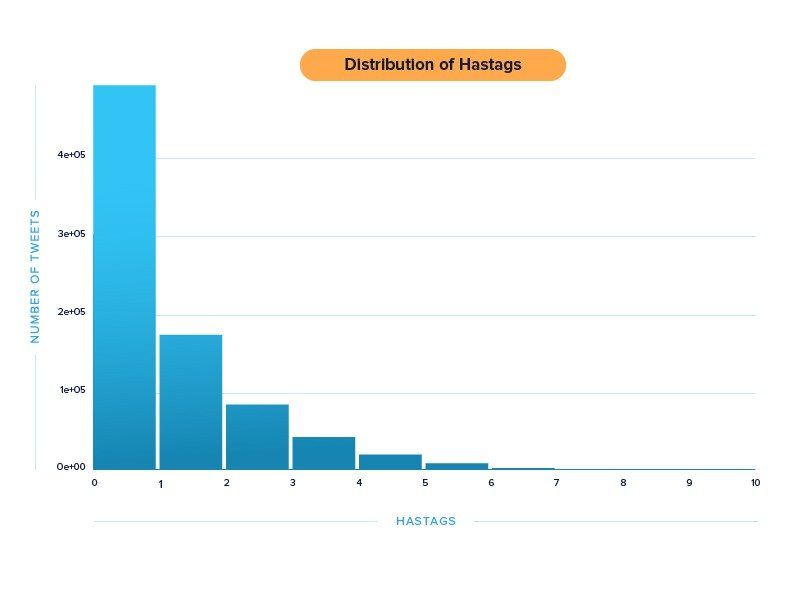
So how many hashtags do people usually use?
The majority of the tweets in our dataset, roughly 500,000, don’t contain any hashtags, and slightly less than 200,000 contain just 1. It’s interesting that there seems to be a clear positive relationship between the number of hashtags and the amount of engagement, yet most tweets don’t quite take advantage!
Further notes about methodology
In addition to the way that we went about measuring engagement (retweets plus favorites plus replies), one might also be tempted to give more weight to retweets because they are often considered to be more valuable than favorites or replies. An engagement measure like (2 * retweets + favorites + mentions) / followers could account for this difference in value, for instance. The challenging part was thinking about exactly how much more valuable a retweet is than a favorite or mention. Is a retweet really worth two favorites? We decided to try to keep the measure simple and minimize the number of underlying assumptions and estimations.
Reflecting on our engagement measure, we thought of other factors that might skew the amount of engagement that a tweet gets. The first such factor that came to mind was the number of followers that an account has.
If we think of engagement as retweets + favorites + mentions, then large Twitter accounts are naturally likely to receive more engagement than smaller accounts, even if the smaller accounts follow the best practices of tweeting. ?
To control for the effect of followers, we used a similar approach used in Dan Zarrella’s awesome study of hashtags, measuring engagement per follower. Using this as a measure of engagement, rather than just retweets + favorites + mentions, helps control for different follower counts and levels the playing field for smaller Twitter accounts. ?
Further notes about the data
It was fun to look at a slice of tweets from the U.S. West Coast set of Buffer users. Here’s why we chose this particular dataset:
With 1 million tweets we were able do a lot of manipulation quite quickly with a sufficiently large sample size. (Most of the analysis was done on a single computer, and analyzing many millions of tweets on one machine could get quite slow. ) We would love to include many more millions of tweets in the dataset, so we’re looking into using some advanced technologies (Spark and the SparkR package) to scale the analysis. Stay tuned. ?
Among the limitations that occur with a dataset of this particular size and scope:
- All results will be skewed toward the sharing habits of U.S., West Coast users.
- Seventeen days of data provided a sufficiently large sample, though in the bigger picture it’s somewhat of a short timeframe. It’s possible that other takeaways could have been found if looking at a different or longer set of dates.
- We did our best to analyze the data to account for differences in the size/following of a profile. We weren’t yet able to distinguish between different industries or topics (which we imagine could be quite a helpful next step for future studies).
Over to you
We’re incredibly grateful to share this data with you (and to have Lemonly’s help with the graphs and graphics), and we’re eager to hear your great thoughts.
Our previous data study had such amazing reactions in the comments. I’d love to be available to bounce around some ideas with you here as well.
What questions does this data bring up for you?
What insights might you take away?
What can we help to clarify or explain?
I’ll be hanging out in the comments along with our data scientist Julian to help with anything we can. Excited to chat this through with you!
Image source: IconFinder, UnSplash, Pablo, Lemonly
Try Buffer for free
140,000+ small businesses like yours use Buffer to build their brand on social media every month
Get started nowRelated Articles

In this article, Nupur Mittal shares insights into four research methods that help her find content ideas and identify unique takeaways.


Facebook marketing in 2019 isn’t dead. On the contrary, it’s far from it. Now removed from the dim outlook that businesses faced at the beginning of 2018, Facebook has and will remain an essential tool for brands’ marketing strategies moving forward. In our big State of Social Media 2019 Report, we found that 93.7 percent of businesses use and are currently active on Facebook — the most among any other social media network. And although we continue to see a dramatic rise in the usage