


Among the many superpowers I wish I had, one that would be quite useful is the ability to understand social media metrics. I know enough to get by, and I love learning the new techniques to get more from these numbers—and to make sure I’m seeking the right numbers in the first place.
In an effort to understand the little bits I can, I’ve done some research into all the many different social media stats you might track and which ones are worthwhile. Wouldn’t you know it, social media stats aren’t just as simple as looking at the right numbers!
There’s a difference between knowing what the stats mean and knowing which stats are meaningful.
With that in mind, I’d love to share with you some of the stats we value greatly here at Buffer and the reasons why, as well as some new social media metrics we’re excited to try.
Why it’s important to know what you’re tracking
What are you hoping to get from your social media marketing?
That’s question No. 1 as you consider which stats to track. If you optimize for sharing, you might do something different than if you optimize for clikthroughs or email signups. Bounce rate might not be as valuable if you’re only interested in a large volume of unique visits.
Lars Lofgren of KISS Metrics has another way of looking at this search for meaningful metrics. Your social media marketing goals require data that helps your decision-making. Therefore, it’s vital that you know what you’re tracking and why.
It all comes down to one thing: does the metric help you make decisions?
When you see the metric, do you know what you need to do? If you don’t, you’re probably looking at a vanity metric.
We feel good when vanity metrics go up, yet we may still feel quite clueless on an overall direction. I’ve been there before. That’s why advice like this from Lars and similar advice from social media experts like Jay Baer are so incredibly helpful.
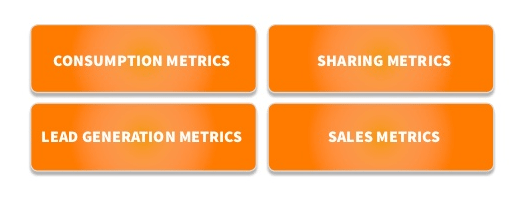
One of my favorite slidedecks of Baer’s covers the metrics of content marketing. He breaks down these metrics into four categories, with each one building upon the previous.
Consumption metrics: How many people viewed, downloaded, or listened to this piece of content?
Sharing metrics: How resonant is this content, and how often is it shared with others?
Lead-gen metrics: How often does content consumption result in a lead?
Sales metrics: Did we actually make any money from this content?
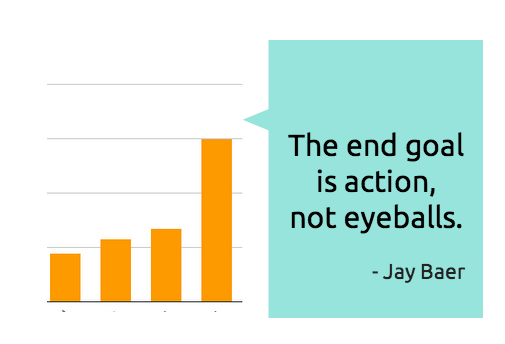
With his four-part metrics formula, Baer comes back to the idea that valuable metrics support overall business objectives. If you know where you’re headed, you’ll know what to track. He has a great way of putting it:
The end goal is action, not eyeballs.
3 tools for tracking your social media stats
Of course, a key to gaining meaning from your stats is to have access to these stats in the first place. You need a way to collect the data that you wish to analyze, which is why it’s nice that there are so many tools out there to help with sorting it all out. Here are three tools in our toolbelt at Buffer.
Google Analytics
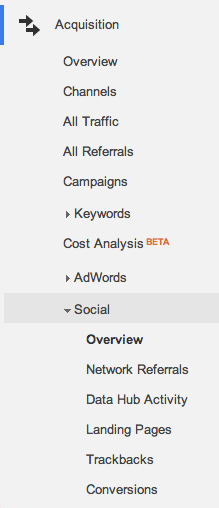
One of the most popular analytics tools out there, Google Analytics can report most anything about your website and traffic, including all the necessary social referrals you’re interested in. We like to pull this data for our marketing reports. To find social referrals in Google Analytics, look inside the Acquisition tab in the left-hand menu.
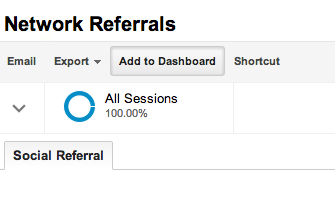
One neat feature of Google Analytics is the ability to create custom dashboards of just the metrics that matter to you. For instance, all these social referral stats could go straight to a social dashboard if you like. To create a dashboard, open any report in Google Analytics, and click the “Add to Dashboard” button that appears at the top of the report, just underneath the report name.
The next screen you’ll see lets you create a new dashboard or add to an existing dashboard. You can also customize the specific types of data that are visible on the dashboard report.
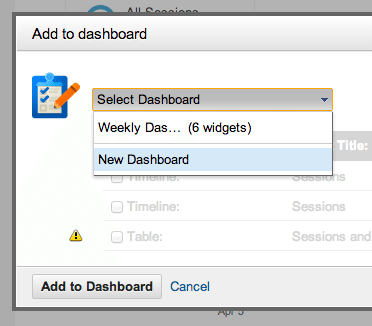
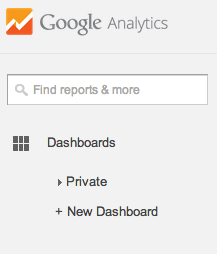
Then, when you’re ready to view your dashboard at your next analytics visit or audit, you can find your complete list of dashboards as the first menu option in the left-hand sidebar.
Buffer (or your own social media management tool)
If you use a social media management tool to keep on top of your marketing efforts, you may be familiar with the tool’s analytics features. We use Buffer for our social media management, and we get great value from the analytics, stats, and charts inside each of our profiles.
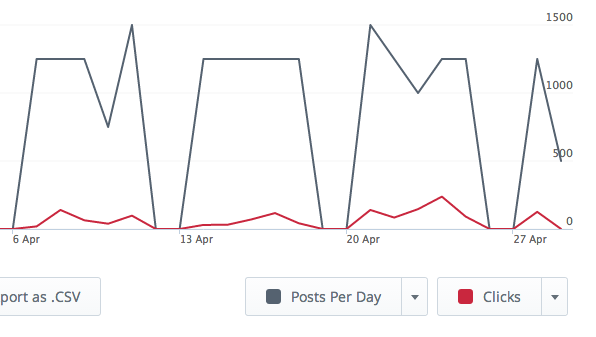
One of my favorite reports to run is the comparison of posting frequency to clicks, shares, and the like. You can even customize the date range to see how your stats look at different stages of your experiments. Here is a chart for Google+ posting frequency compared to clicks.
True Social Metrics
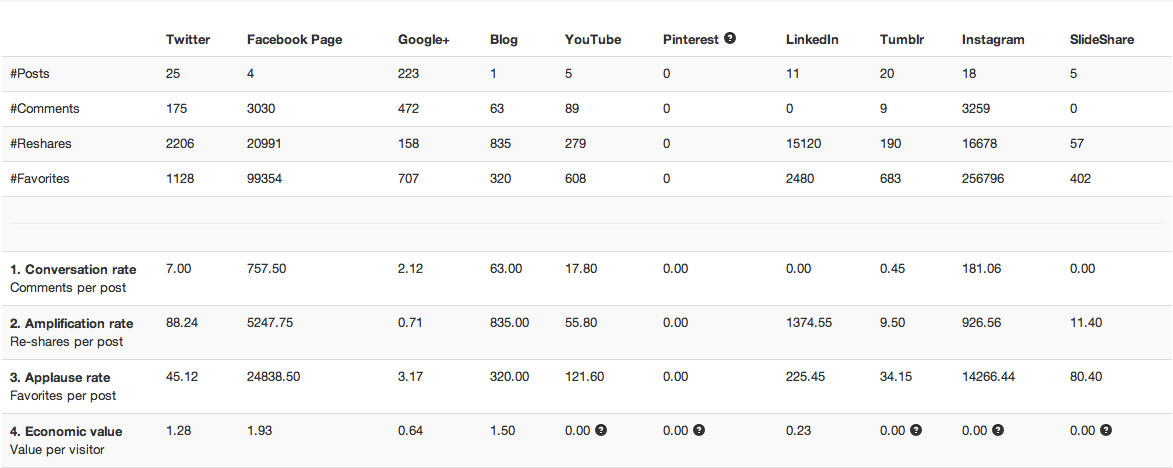
A complete dashboard of analytics for Twitter, Facebook, Google+, LinkedIn, Instagram, Pinterest, your blog, and even more, True Social Metrics tracks important metrics like updates, comments, reshares, and favorites and places them all onto a neatly-organized view. The way True Social tracks metrics is particularly unique as they follow a method designed to highlight the most relevant parts of social media marketing (more on this below).
Here’s a sample dashboard of the reporting you can get from True Social.
Definitions of popular social media metrics
To understand where we’re headed with this discussion of social media metrics, it will probably help to start with some definitions. I know I struggled for a bit with grasping what some of the popular metrics were really getting at, so I hope it’s helpful to see it all laid out here.
(Note: There may be some variation in definitions from the terms below, based on how different marketers choose to measure and define them. I tried to get the most common explanations here.)
Conversions = the number of people who achieved a desired result. This could be paying for a product, signing up for a trial, completing a form, or any other goal you’ve set up for your campaign.
Leads = potential conversions. These include anyone with the need or interest to pursue your product or service.
Engagement = the total number of likes, shares, and comments on a post.
Reach = a measurement of the size of audience you are communicating with.
Impressions = a look at how many people saw your post.
Funnels = The paths that visitors take toward converting.
Visits vs. unique visits = Visits count each time a person visits your site or page, regardless of whether or not they have visited before. Uniques count each person only once.
Bounce rate = The percentage of people who land on your page and immediately leave, without viewing any other pages. Rate at which people leave your site after viewing only one page.
Exit rate = The percentage of people who leave your site from a given page. It’s possible these people have browsed other pages of your site before exiting.
Time on site = a measure in minutes and seconds of how long a visitor stays on your site before exiting.
Audience growth rate = a comparison of your audience today to your audience yesterday, last week, last month, etc.
Average engagement rate = individual post engagement compared to overall followers.
Response rates = These can be measured in two ways, either as the speed with which you respond to comments and replies on social media, or how quickly your marketing or sales department follows up with leads from social.
Inbound links = the number of sites linking back to your website or page.
These definitions cover many of the basics. For more nuanced social media stats, you can try out these advanced posts from The Next Web and Convince and Convert, or our massive list of 61 social media metrics.
The No. 1 metric: Conversions?
As Jay Baer said, we’re after action, not eyeballs. Conversions are the way to measure the action.
Ultimately, you want the work you do on social media to lead to a paying customer. That’s the ultimate conversion. It may be the case, though, that it’s quite a ways from social media to checkout. In that sense, should conversions be the main metric to consider?
Certainly, they should be a consideration in your social media marketing strategy. You could also choose to place an emphasis on leads.
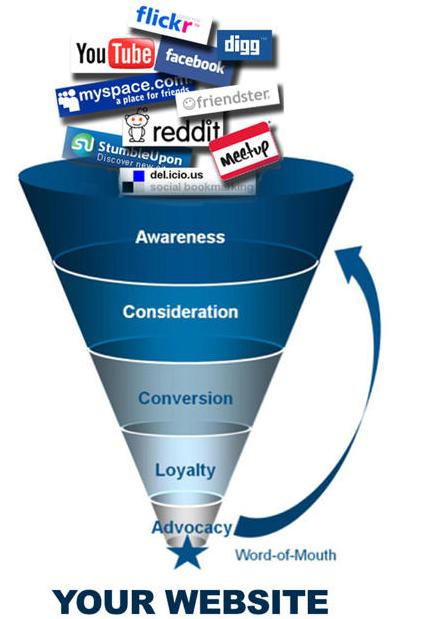
We aim for a balance of both with the work we do on the Buffer blog and on our various social media profiles. If you consider social’s place in a marketing funnel, it’s likely to be at or near the top. The more leads we can capture, the better. The more conversion insights we get, the better we’ll know how to target the leads we pull in.
Here’s the way that Social Market Buzz shows where social fits in their funnel:
The ultimate system for tracking engagement on social
As we work toward investing in our social media communities here at Buffer, we expect to try out a lot of new experiments along the way in terms of the best ways to measure our efforts and the best types of content that truly engage with our audience.
One of the experiments that we’re really eager to try is a new way of looking at engagement. First proposed by Avinash Kaushik back in 2011, this theory of engagement breaks the metric into four parts that are you’ll find to be consistent across all social networks:
- Conversation
- Amplification
- Applause
- Economic Value
Conversation rate: This is simply the number of conversations per social media post. On Facebook, Google+, and LinkedIn, this would be comments. On Twitter, it’s replies.
Amplification rate: This measures the number of reshares or retweets on average for each post.
Applause rate: This accounts for the various ways a user can promote a post on different networks—Retweets, Likes, +1s, etc. (Side note: I love the word “applause” to describe this metric).
Economic value: According to Kaushik, this value is the sum of short-term revenue, long-term revenue, and cost savings
A community we greatly admire, Moz, uses these tracking methods for their social media marketing, and they shared a bit behind their process for putting these numbers together. They use True Social Metrics to compile the numbers and some custom spreadsheets and reports to track and share with the team.
I put together a quick snapshot of the past three weeks of Twitter data for our Buffer account, based on Kaushik’s four-part method. Economic value is still something we’ll need to work out here, so the chart includes conversation, amplification, and applause. Here’s how it looks:
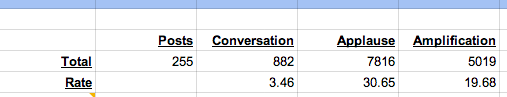
I extracted the numbers directly from our Buffer analytics dashboard and then ran a couple formulas to get the end results. If you’re interested in borrowing the spreadsheet I used, you can download a sample here.
So what to do with this data?
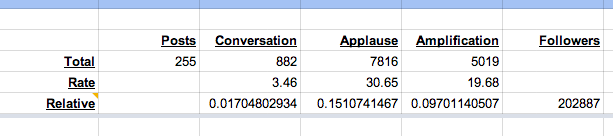
Moz has a brilliant interpretation of the numbers they get here. They figure the conversation, amplification, and applause rate per follower so that they can better measure the growth from week to week and month to month. Here’s how they come up with their relative engagement rates:
Relative Engagement Rates – So, you have all these engagement metrics, but what do those numbers even mean? How can you compare the conversation rate on Facebook with the conversation rate on Instagram? This is where the relative rates come in, think of it as the average number of conversations happening per post, per follower (fan, encircle, etc.).
If we were to do this with our Twitter example, here’s how the relative engagement rate might look:
Which do you prefer: Reach vs. Engagement
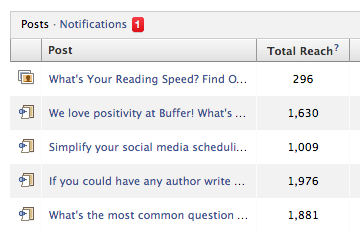
We social media marketers have had a tough time wrapping our heads around Facebook organic reach lately. It seems to be declining for everyone, which is discouraging since it is the one stat that Facebook most prominently displays in its Insights reports (as well as many other places around the page).
But maybe reach isn’t the stat we should be most concerned about.
What does reach tell us anyways? It is the number of people who see your post in their timeline, and reach is calculated by a Facebook algorithm that seeks to show Facebook users the content they most want to see. As Jon Loomer suggests, reach is cutting quite an efficient path to your most tuned-in followers.
Instead of chasing reach, maybe engagement is a better alternative.
That’s one of the theories we’re testing out now. Are we better off with a post that reaches far and wide or a post that is incredibly meaningful to a smaller number?
In some ways, it’s a paradoxical question. Engagement is part of the reach algorithm. When someone clicks, shares, or comments on an update, Facebook takes that as a hint that the user wants more content from that page.
In this sense, focusing on engagement may very well lead to a larger reach organically. It’s an experiment we’re excited to try (and we’ll be sure to keep you informed on how it goes).
Which do you prefer: Retweets vs. Clicks
One of the many A/B tests we perform on the Buffer blog is to see which headline performs best. We use Twitter as our testing tool, posting variations of headlines and measuring the response. The headline with the best response becomes the new headline on the post.
What specifically are we looking at when we measure this?
We look at the data inside Buffer’s analytics, so we can quickly see how many retweets, favorites, mentions, and clicks the post received. Here is a sample of a recent tweet from our Google+ tips post.
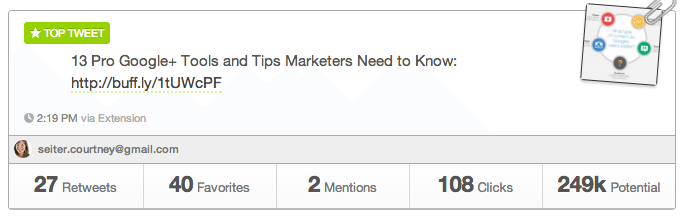
In general, we are hoping to see a clear winner in a majority of the stats. When that’s not the case, we have a choice to make. Are we more inclined to clicks or retweets?
Clicks tell us that the headline is interesting and helpful on an individual level. Someone reads the headlines and wants to know more about the story. In general, this is our No. 1 metric to determine the headline winner.
Retweets tell us that the headline is interesting enough to share with all of someone’s followers. This is a substantial compliment and one that speaks to the virality of the headline.
So in some ways, clicks vs. retweets comes down to individual appeal vs. mass appeal.
Which one would you find more value in?
Which do you prefer: Traffic/day vs. Traffic/post
When it comes to blog traffic, we have enjoyed running some new experiments on what to post and when. One of those experiments has been posting on Fridays.
We published an article about new Twitter profiles on Friday, April 18.
For that Friday, we received 27,282 visits to the blog.
The previous Friday, with no new post, we had 28,334 visits.
So it’s safe to say that the Friday post wasn’t a hit?
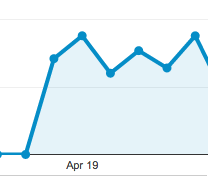
Curiously, no. The new Twitter profile article has been the fifth-most popular article on our site in the past 30 days! The post received more traffic on Saturday, April 19, than it did on Friday, April 18. It received its second-highest traffic spike on the Wednesday following its debut (no doubt as the new Twitter profiles kept rolling out and social shares went up). See the graph below for how the traffic to this post went through quite an unusual cycle of highs and lows over nearly a full week’s time.
What can we make of this information?
A couple of takeaways here: Perhaps we should be more interested in traffic per post than in traffic per publish day when we’re evaluating the content we product. Maybe Big Fridays aren’t as important as Big Articles.
In that sense, it could be possible that pageviews per post are more important than pageviews per day. It’s a theory that bears a little more monitoring for us, but one that nonetheless might be worth investigating in your own content.
Which do you prefer: Pageviews vs. Attention
One of the hottest metric debates over the past month or so has been whether content creators should be more interested in quantity of visitors or quality of visitors. Put another way, which is more important: pageviews or engaged time?
An article by Tony Haile at Time.com is a touchstone for this discussion. As the CEO of Chartbeat—a real-time analytics tool—he sees just how fleeting the average page visit can be. According to his data, 55 percent—the majority—of visitors spend fewer than 15 seconds actively on a page.
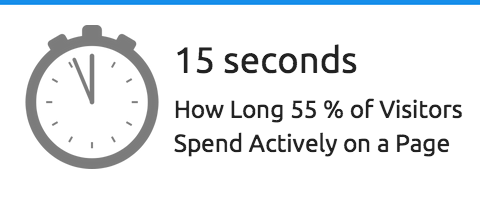
Because of this, there has been a great push to value Engaged Time over Pageviews.
And just as this push has come, so has the pushback. Many articles have come to the defense of the Pageview.
The debate goes like this: The attention crowd argues that pageviews are a vanity metric that fails to relate whether or not a visitor even read or understood the page they were on. Pageview fans mention how difficult it is to accurately define and track a metric like engagement and how, by comparison, pageviews are straightforward and key parts to a well-rounded strategy.
So where does the Buffer blog fall on the debate of Pageviews and Attention?
Our top blog metrics: Subscribers and Uniques
For the Buffer blog—as with the majority of our social media marketing—we consider our efforts here to be at the top of our conversion funnel. In other words, we aim to cast a wide net and bring in as many different leads as possible while helping to spread awareness and authority.
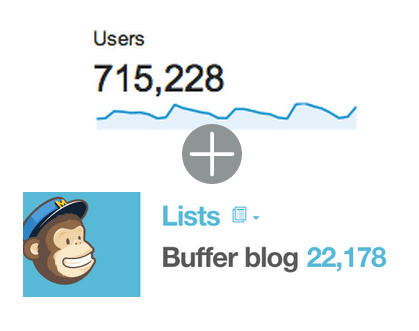
With this breadth in mind, we specifically aim for growing our list of email subscribers and boosting our unique visitor traffic.
(Our next two most important metrics are social shares and conversions.)
We value email subscribers so highly because these folks have given us permission to contact them directly. It’s a huge privilege to be invited into the inbox and a great opportunity to share content and announcements that we know they’ll love.
We value unique visits, too, for the awareness they provide in regards to the Buffer product, our culture, and our social media influence. We trust it’s a good first impression that these new visitors make and that they’ll return, eventually, as customers.
One specific way that we seek to grow these numbers is through our many republishing efforts at Time, Fast Company, Inc, The Next Web, and others. By getting our content onto sites with huge audiences, we can hopefully gain new traffic and leads through the incoming links from those articles.
Final call: Which social media metrics matter to you?
It’s been great to share a bit about the social media metrics and blog stats we find valuable here at Buffer. I’d love to hear which ones you use in your marketing strategies!
Share your favorite metrics in the comments, or feel free to ask any questions about the way we do our metric tracking. It’ll be awesome to keep the conversation going with you.
P.S. If you liked this post, you might also like The 15-minute Social Media Audit Everyone Can Do and The 7-Day Plan for Improving Your Marketing Metrics Week Over Week.
Image credits: Thomas Hawk, Social Market Buzz.
Try Buffer for free
140,000+ small businesses like yours use Buffer to build their brand on social media every month
Get started nowRelated Articles

This article looks into social media benchmarks for various industries and platforms.

A guide to the content marketing metrics that will help you measure success, plus guidance from top content marketing leaders.

In this guide, we’ll go through everything you need to know about TikTok analytics — from what metrics and insights are available to how to get all of them for free to what you can do with them to boost your growth on TikTok.