


We share, share, share to social media. How can we tell what works?
This is a question I ask myself each week as I review the Buffer social media stats. How can I evaluate and optimize my best social media content?
Where do I even start?
Having asked the question myself so many times, I’ve found a few different options for analyzing how social media content performs. I’m still experimenting with which way is best, and I’m happy to share with you all the many different ways I’ve tried so far. I’d love to hear any advice or ideas from you in the comments.

5 Ways to Evaluate and Optimize Your Best Social Media Content
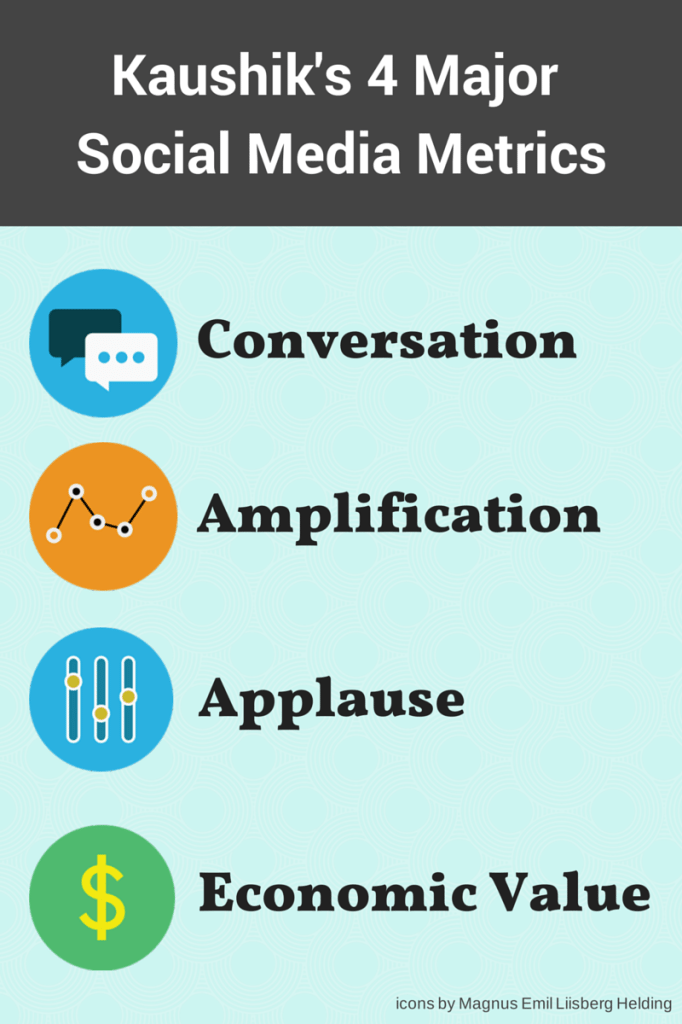
1. Kaushik’s 4 Major Social Media Metrics That Work on Every Channel
Avinash Kaushik’s four major social media metrics were designed as a foil to the somewhat popular notions of chasing vanity metrics like follower count, number of posts, and other low-value statistics.
What matters is everything that happens after you post / tweet / participate!
Did you grab attention? Did you deliver delight? Did you cause people to want to share? Did you initiate a discussion? Did you cause people to take an action? Did your participation deliver economic value?
To that end, Kaushik’s four metrics are as follows:
Conversation rate – The number of conversations per post. On Facebook, Google+, and LinkedIn, it’s comments. On Twitter, it’s replies.
Amplification rate – The number of reshares or retweets per post.
Applause rate – Retweets, Likes, +1s, etc.
Economic value – The sum of short-term revenue, long-term revenue, and cost savings
His four metrics, first explained in a 2011 blogpost, continue to be influential in the way that we evaluate our social media performance. Moz uses Kaushik’s methods in their social media marketing; we’ve done the same at the Buffer blog. There’s even an analytics tool, True Social Metrics, based on these metrics.
What’s great about these four metrics is that you can find them on every social channel. They are independent of the social network.
And taken one step further, Moz even adjusts the rate to reflect the amount of conversation, amplification, applause, and value per customer. Their relative engagement rate is essentially the average number of, say, conversations happening per post, per follower.
How might you figure these stats for yourself?
Here’s a Google spreadsheet template to get you started.
The easiest way to grab this data might be to extract it from your social media management tool (for instance, there’s a spot in Buffer for Business analytics to export big chunks of data per profile).
Then once you have the data, add up the total of conversation, amplification, and applause for a given time period, and divide each total by the number of posts.
Economic value will require a bit more homework on your end. You’ll need to assign monetary value to the different actions that occur via social media and your sales funnel. Kaushik wrote a pair of helpful posts on conversions and economic value that can help sort this out.
2. Share Score
For several weeks now, we’ve been experimenting with a single score for analyzing blogposts. The score, devised by the content team at Moz, takes into account a number of different factors with accordingly different weights. In our case, we use comments, social shares, unique visits, time on page, and syndication as a few of our signals for a quality blogpost.
All the factors get mixed and calculated, and out comes a clean and simple score, showing posts that perform above average and those that underperform.
We’ve since brought the blogpost score over to our social media sharing.
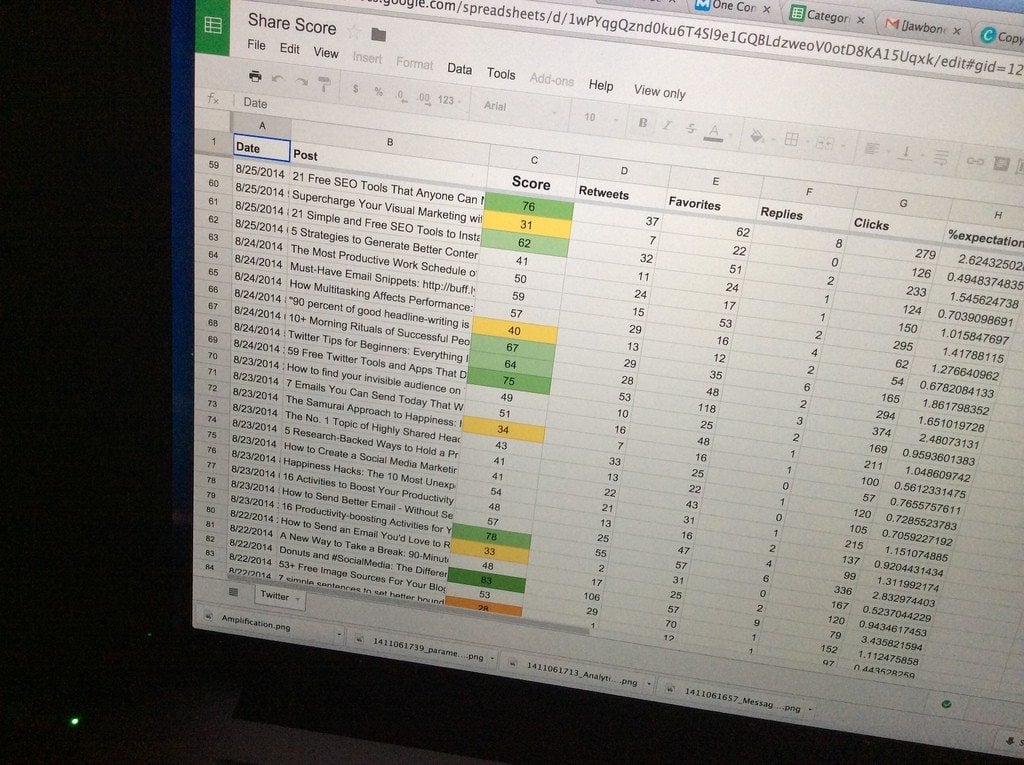
With the share score, we can see at-a-glance which posts perform best throughout a given week (and which ones could be improved). Again, to emphasize the numbers here, the score shows how a post performed compared to the average: Scores higher than 50 are above average, scores lower than 50 are below.
How can you grab this score for yourself?
Start with this spreadsheet. It’s a copy of the one we use for our social media score here at Buffer.
Basically, here’s what the spreadsheet is doing:
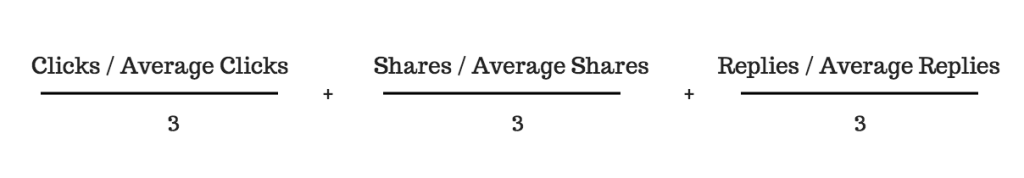
- It’s a three-part formula. Each part accounts for 1/3 of the total score.
- For each part, the post is compared to the average of all posts in the range. For instance, if you’re pulling data for clicks, the clicks for that post will be divided by the average clicks for all posts.
- The ‘%expectations’ column is the composite of the three-part formula. It’s a messy number.
- Some fancy formula (HT: Moz) makes everything into a sensible scale of zero to 100 with 50 being average.
Here’s what the actual formula for %expectations looks like:

Put another way (for example):
What we love about this score is the customization options.
You can change the three parts around to your liking by focusing on whichever three metrics are most important to your social media sharing.
Then you can go a step further and change the weights of each.
Currently, all three metrics are weighted equally with a 1/3 multiplier on each. But let’s say you want to really focus on clicks and not so much on reshares or replies. You could bump up clicks to 2/3 and change reshares and replies to 1/6 each.
One other note about how we use the score: It’s great for evaluating how posts have performed; it’s not ideal for setting benchmarks. Since the score is relative to the average expectations on an update, your best takeaways will be learning which posts performed best, rather than where to set your goals moving forward.
3. Sorting columns
Phew. Those first two methods of analyzing social media were pretty intense. So here’s a much more straightforward one for you: Sorting from top to bottom.
How can you figure out these stats for yourself?
I’m grateful to use Buffer for Business analytics for my sorting. You can likely find these numbers in a similar way in your social media management tool of choice or in a spreadsheet with exported data from your account.
Then it’s just a matter of clicking. Find the stat you want to sort by, and click to sort.
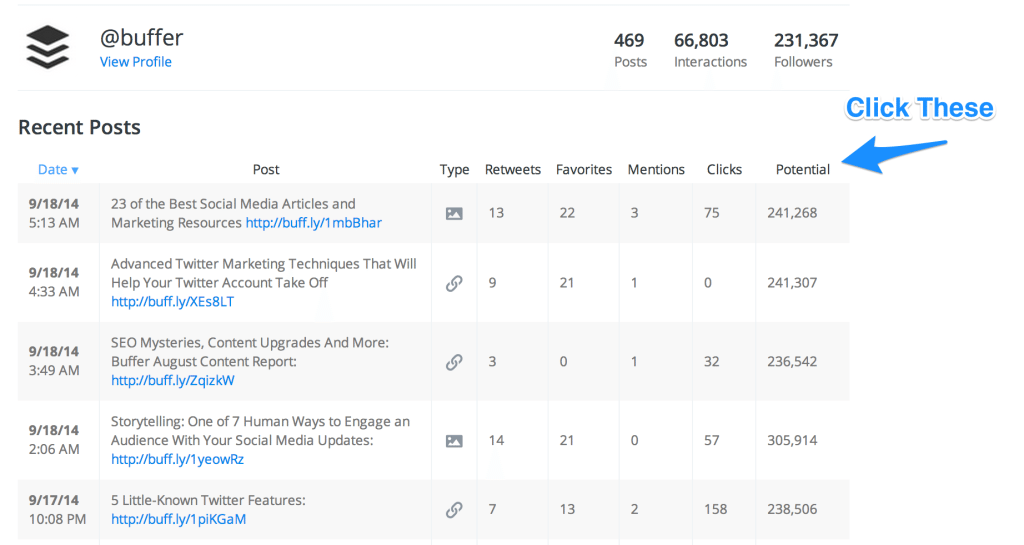
Lately, I’ve been focusing my Twitter goals on gaining 200 clicks per tweet. To get there, I’ve been studying which tweets pass that threshold, and finding this number is super easy with the sorting method.
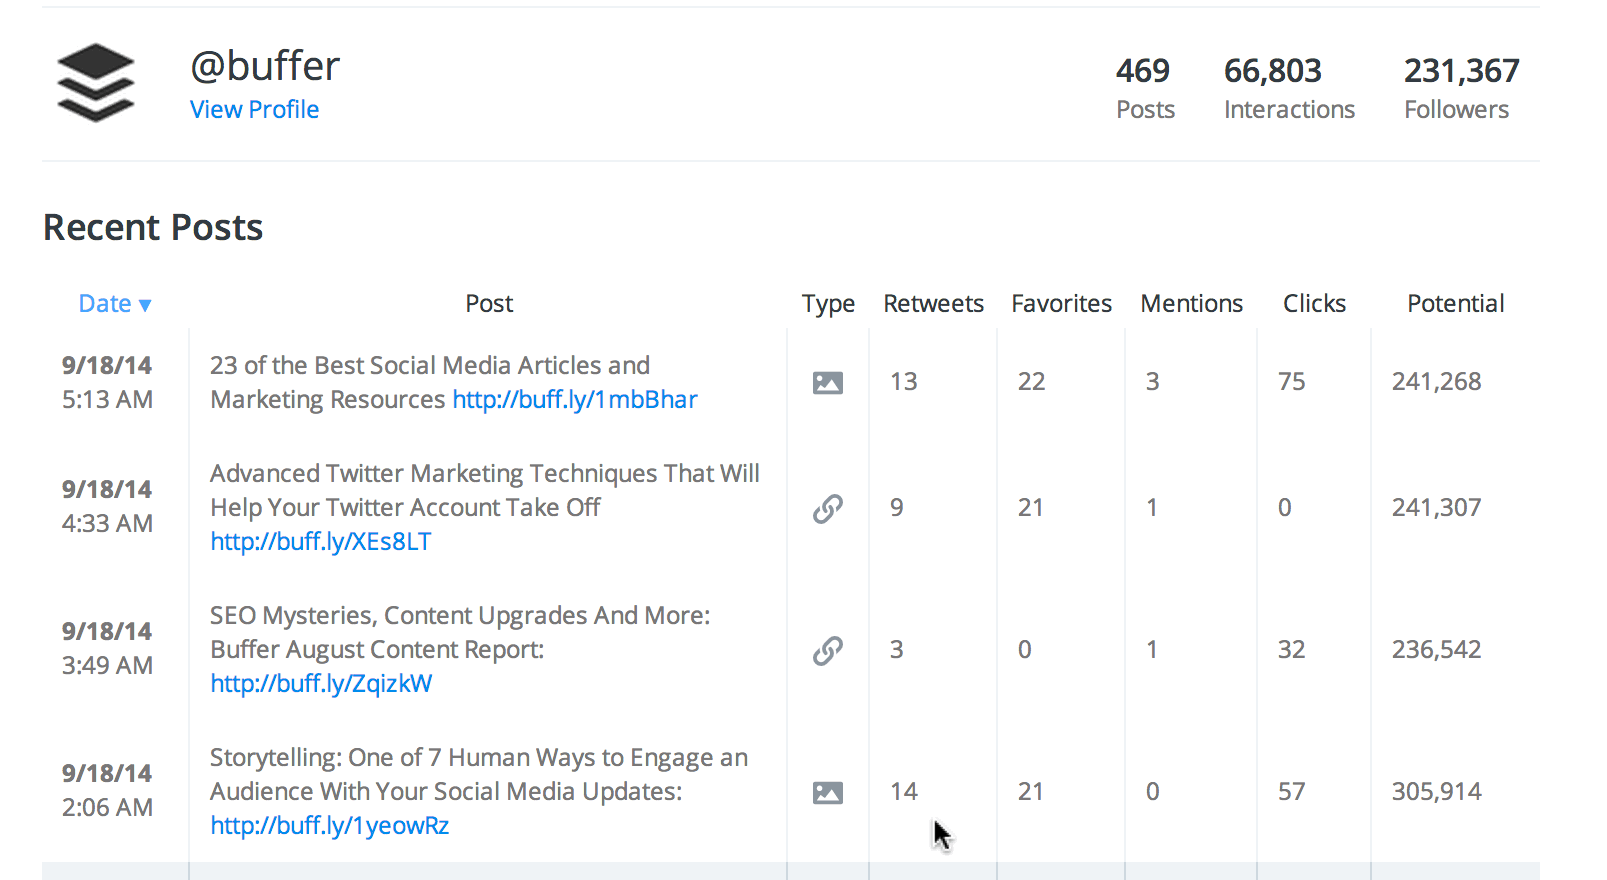
What to do with this data? Here’re a few things I tend to notice.
- Were these top posts sent around a similar time?
- What was the topic/category?
- What type of post were they: picture, plain-text, other?
- Were reshares and replies also high?
4. Revenue per channel
So far, only one of the methods I’ve listed here considers revenue as part of the analysis (and that method, Kaushik’s 4-part metric, counts economic value as 1/4 of the puzzle). If you want to truly focus on the economic impact and ROI of social media, it might make sense to chart and track revenue per channel.
This metric is somewhat self-explanatory, with a twist. Let’s say someone places a $50 order through your site, and the customer came to your site five times before ordering—twice from social media, twice from organic search, and once from email. In this example, revenue per channel would be $20 for social, $20 for organic search, and $10 for email.
You can then add the breakdown of all orders for the month to find the monthly revenue per channel.
How can you find revenue per channel for your business or brand?
It starts with some advanced analytics.
You’ll need to be able to see the customer journey of everyone who completes an order for your product or service. Google Analytics has some neat features that can help with this, and SaaS tools like KISSmetrics can help as well.
The closer you can get to charting your customer journey like this, the better:
Once you have the tracking in place, you can then assign revenue per channel for each order. Simply divide the revenue from an order by how many referred visits the customer took to your site.
Add up the results from multiple orders to arrive at the overall revenue per channel for the week or month, and then use that metric to compare week-over-week and month-over-month growth.
5. The category and call-to-action spreadsheet
Social Media Examiner shared their comprehensive Excel spreadsheet for evaluating and optimizing social media content. The spreadsheet covers 14 different variables for each social media post.
- Date
- Network
- Categories
- Subcategories
- Target
- Calls to action
- Meta-tags
- Posts
- Impressions
- Comments (replies)
- Likes (favorites)
- Shares (retweets)
- Clicks
- Total engagement
Of particular note are the category and call-to-action columns.
Categories / Subcategories – These function similar to the way that categories and tags work on a blog. The categories are the major topics that your post covers. The subcategories are the specifics.
Calls to action – The text being used to encourage someone to click. Examples include “subscribe,” “read more,” or “buy now.”
The other columns in the spreadsheet that might merit explanation are target (the persona or demographic for your intended message) and meta-tags (even more detailed descriptions beyond categories and subcategories).
How can you make your own spreadsheet?
I’ve got a template for you to start with.
Then the next step is to fill the spreadsheet with data. I’ve mentioned export options many times in these various metrics, and this would be another good place to use them. Both Twitter Analytics and Facebook Insights have export features, as well as most social media management tools.
Once you’ve input a large amount of data, you can then sort and filter the data to show performance of posts per network, per category, and per call-to-action.
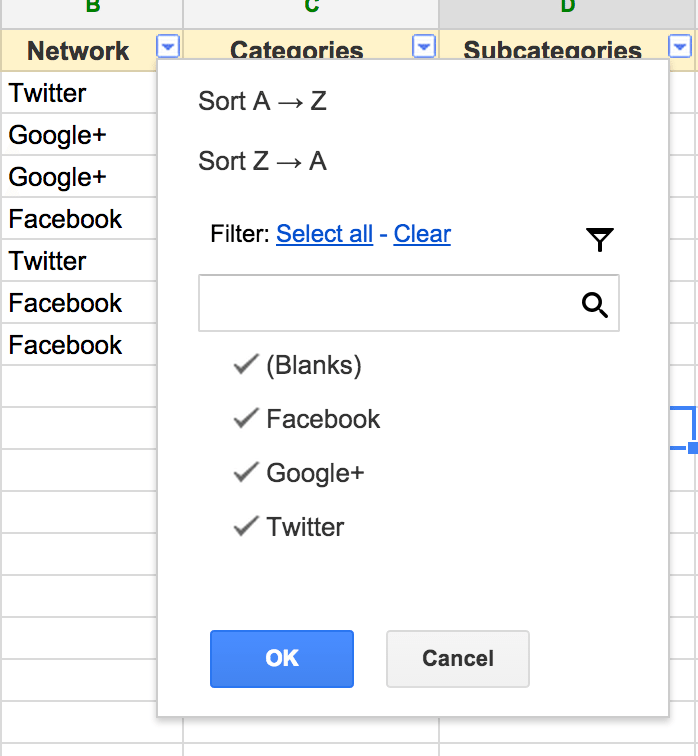
The thinking here is that you’ll discover some valuable insights into what is working best—both in terms of categories and the words you use.
Conclusion
Which methods have you tried for evaluating and optimizing your social media content?
After giving each of these five methods a look, I’ve settled onto the click-to-sort method and the share score as my go-to ways for seeing what works on social. And I’m always on the lookout for even more ways to analyze. If you’ve got a favorite way that I didn’t cover here, I’d love to know about it! Feel free to share in the comments.
Image credits: Markus Spiske, Google,
Try Buffer for free
140,000+ small businesses like yours use Buffer to build their brand on social media every month
Get started nowRelated Articles

This article looks into social media benchmarks for various industries and platforms.

A guide to the content marketing metrics that will help you measure success, plus guidance from top content marketing leaders.

In this guide, we’ll go through everything you need to know about TikTok analytics — from what metrics and insights are available to how to get all of them for free to what you can do with them to boost your growth on TikTok.