


The ideal length of a blogpost is six minutes and 1,500 words. So every blog post you write should aim for that golden, gooey length, right?
Well, there’s a bit more to it than that.
We love digging up the latest stats and best practices on how to share better on social media. And our findings are just that: General statistics and ideas on what might work best in practice. Many stats are jumping off points for you to test and iterate on what’s best individually and personally for your sharing.
Stats don’t lie. They just might not be telling the story you expect.
So I thought I’d open up the discussion for what social media data and best practices don’t tell you and how to improve your social media experience from a healthy perspective that includes data, statistics, and other factors that matter to you.
An example of when data might not tell the whole story
Let’s revisit one of our past posts about the ideal length of everything. One of the research studies claimed that the length of an ideal tweet was 100 characters.
So does that mean we’ll see improvements if we aim our tweets for the 100-character mark?
Maybe not. Here’s a comment from the article explaining why.
Here is my ideal, optimized, 100-character tweet: “Purple dinosaurs eat green carrots off your face if you let them. Nancy Pelosi is 25 percent poodle.”
Without meaning or context the number of characters you use is 100% senseless.
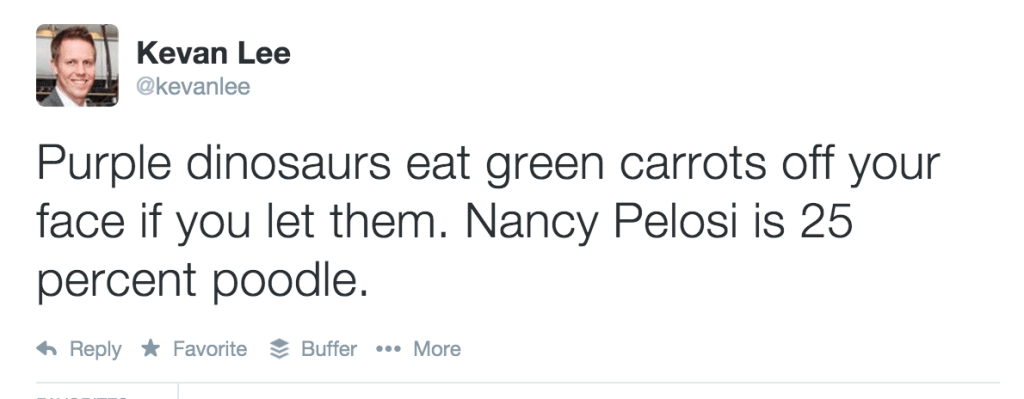
Clearly, not just any 100-character tweet will do.
Yet at the same time, we believe that the 100-character mark is a good guideline for marketers to keep in mind. It’s good advice to follow. The danger lies when you take it at face value and don’t apply a bit of critical thinking and self-examination to the numbers. Let me explain.
Tips on how to read data-backed posts
How prolific is data in our daily content? It’s becoming quite regular to see posts that are “data-backed” and “research-driven” as well as posts that reference numbers and studies in supporting their conclusions.
Here’s a neat infographic produced by the Data, Analytics and Security Working Group of the Application Developers Alliance, a non-profit support group for developers.
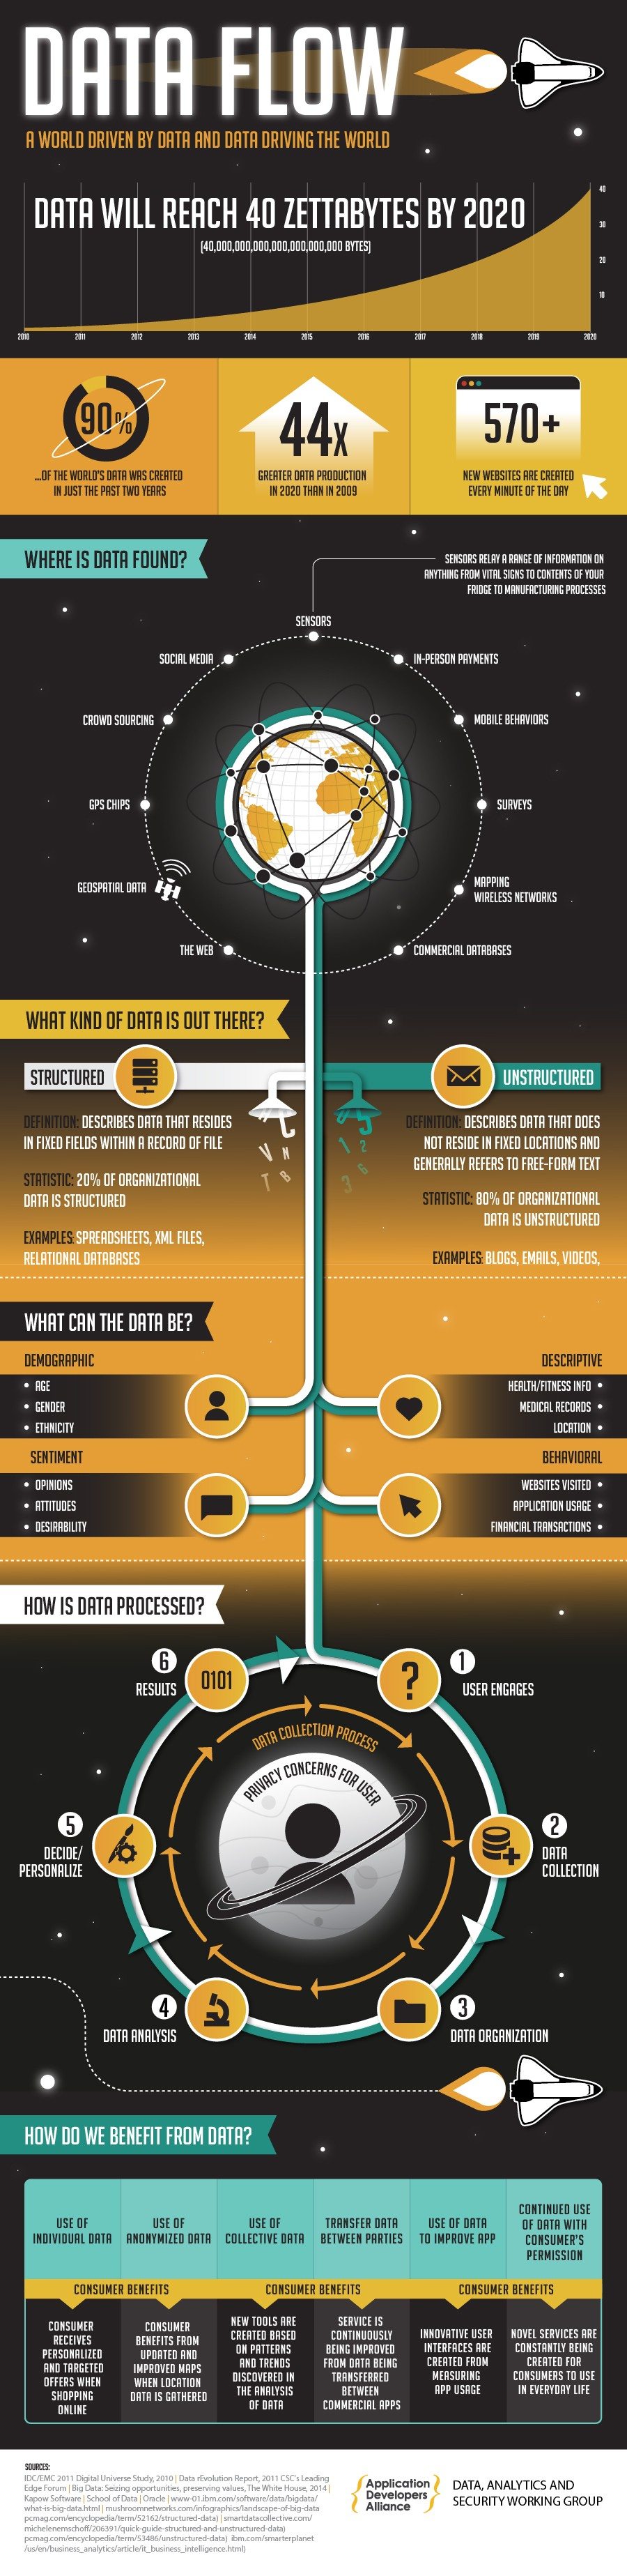
As data keeps moving forward, it becomes more and more valuable to learn how to read and interpret the data. Here are a few ideas.
1. Look at the study itself
If I were to tell you that my Twitter study of over 5,000 tweets revealed that the hashtag #Wrestlemania led to a 200 percent increase in tweet engagement, what might be helpful for you to know?
The timeframe – Was this study performed during Wrestlemania?
The data source – Were these tweets from people in Idaho where Wrestlemania is super popular?
The research methods – Did I attempt to do a proper job of finding representative samples and putting in the proper checks and balances to arrive at meaningful conclusions?
The method of the study has a huge impact on the meaning of the results.
2. Understand how the conclusions were drawn
Two people can look at the same study results and draw different conclusions. How is this possible? It’s a matter of perception and agenda, which is why it’s best to check out the source to see where these conclusions came from.
3. Use your intuition
When you see advice to write a 1,500-word blogpost, you likely will not head into your archives and re-engineer every single one of your blogposts to fit that ideal length, making succinct ones more wordy and wordy ones more succinct.
With this in mind…
How we use data at Buffer
When we see a research-backed guide to sharing on social media, our eyes light up and we scurry to our Buffer accounts to try it for ourselves.
The keyword here is try. We’ll try before we adopt.
We view social media data and research as a source of inspiration for our experiments on social and content marketing. We aim to not take any bit of advice as must-do until we test it for ourselves and see what works.
Brian Balfour, writing at CoElevate, put this matter of data and best practices into great perspective. It’s advice we’ve taken to heart as we discover and use the latest research and trends.
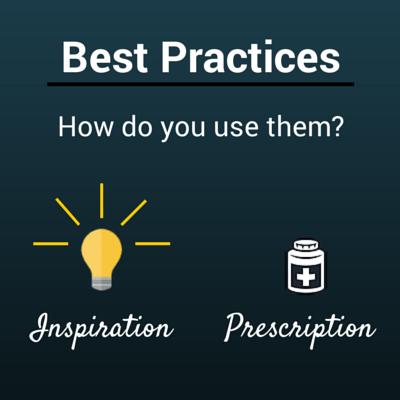
A lot of the content I’ve seen promises proven tactics, rules, or the ‘right’ way to do things. But there is evidence showing how common prescribed tactics actually performed worse (much worse!) for certain companies.
My point to calling this out? Don’t take anything you read on growth (including my material) as prescription. Always, and I mean always, view it from a lens of inspiration.
Gregory Ciotti summed up Balfour’s comments in a great way.
Truly sustainable growth is context dependent, and is never one-size-fits-all.
We’ve gone down this path with the way that we apply what we learn online. We view best practices and research-backed advice as interesting ideas to try and new ways to experiment.
We test.
We trust the results.
If things match up, great! In those instances, we’ve found a best practice that works best for our specific situation. If things don’t work out, no problem. We go with what works and we seek new ways to keep improving.
One area where this has come up is with social timing. We’ve published a blogpost about the best times to post to social media, including specific data about what’s best for Facebook. We took these Facebook numbers and tried them for ourselves.
According to a Track Maven study, the best time to post on Facebook was between 5:00 p.m. and 1:00 a.m. Eastern Time.
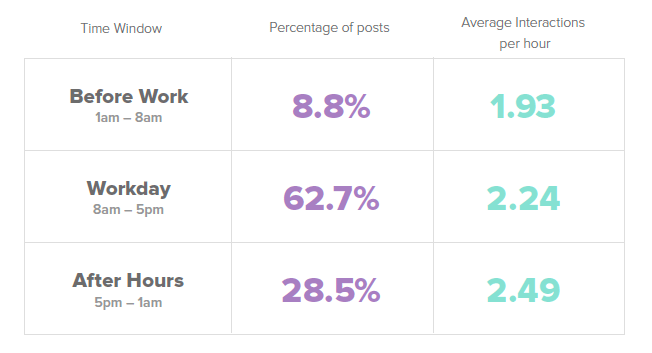
The study also showed that early in the morning was the least effective time of day to publish a Facebook post.
We loved discovering these data-backed practices, and we put them right to the test. Our results: Late night was indeed a great time to post, and so was early in the morning. Our least effective time was mid-day.
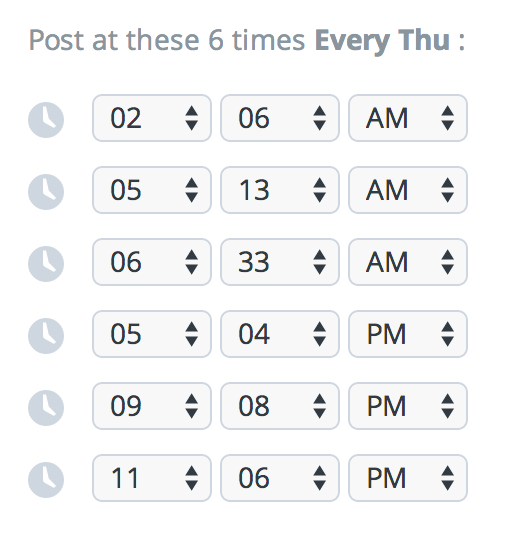
Here’s the schedule we’ve landed on for Thursdays (times are Central Time).
How might our actual experience have differed from Track Maven’s well-researched numbers?
Track Maven looked at over 5,800 Facebook pages and over 1.5 million Facebook posts to come up with its best practices. What we don’t know is the specific demographics of those pages. For instance, what is the international audience for those pages? Where are their fans located?
We share on Twitter with a worldwide audience, so a post at 2:00 a.m. Central Time arrives at 8:00 a.m. London time.
It’s little factors like these that might turn a best practice on its ear once you test, measure, and iterate on this data-backed advice.
A time for best practices and a time for innovation
We strongly believe in the power of data-backed posts that are rich in research and statistics. It is a building block for our content strategy.
Are these posts right for everyone?
We like to think that they provide inspiration for any online marketer, no matter where they’re at in their journey. At the same time, there seems to be a scale of usage with these types of best practices.
New websites and marketers copy the advice to a tee.
Established websites and marketers take inspiration, then find what’s best for them.
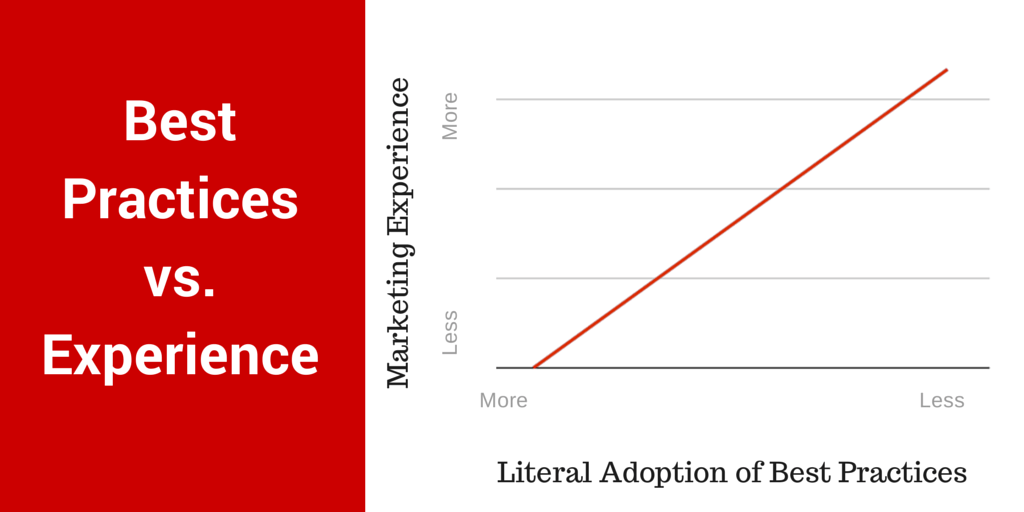
There comes a point in one’s marketing efforts where one-size-fits-all advice just doesn’t fit anymore. And that’s perfectly fine. It’s a natural progression from community-driven marketing strategies to an autonomous, individualized system.
Here’s how Gregory Ciotti explains it:
Online marketing, a field which benefits greatly from rigorous testing and thoughtful looks into a multitude of data, sometimes has to face the double-edged sword of best practices. Though they encourage tested tactics, what works for one may not work for all.
Copying best practices is absolutely advisable when you’re just getting your feet wet. If you don’t know what to do, why not take advice from candid, trustworthy experts? It’s the reason why entrepreneurs are (or should be) some of the best-read people on the planet – condensed knowledge that took years to formulate can be consumed in mere hours from a good book.
Which camp do you fall in?
Your answer likely will color your perception of these data-backed posts.
New perspectives on “the ideal length of everything” and “ultimate guide” posts
The Washington Post had an interesting take on the validity (or non-validity) of “ultimate guide” posts, which make up a regular part of our Buffer content output.
Instead of striving to present “all you need to know,” isn’t it more wonderful to acknowledge the tininess of our window on the world, a pinhole which, if positioned right, might allow our readers to glimpse something really distinct and particular and beautiful? Here’s a different catechism: the smaller and more deeply-investigated an idea is, the truer it is likely to be.
Put another way: Ultimate guides attempt to cover every little thing you could possibly ever want to know when taking on such an ambitious aim is kind of impossible. You can’t cover everything. You can cover one thing incredibly deep.
Switching gears to “ideal” posts, the same can be true. What is ideal for one might not be ideal for another. In these cases, you might find individual factors that are more important to you and the way you approach things.
For instance:
- The quality of message
- Best practices for your niche/industry compared to best practices in general
- Your specific marketing goals
- Your time
- Your resources
Can you think of any other factors?
Over to you: How does data affect your decisions?
We love data at Buffer. It’s all over our social media tips and articles.
At the same time, we understand where this data-backed advice fits within our marketing strategies. We use data for inspiration and experimentation. Test everything, keep what works.
How do you think in terms of data-backed research and so-called “ideal” posts? What does this advice look like for you?
It’d be awesome to hear from you in the comments.
Image credits: Infogr8, Markus Spiske
Try Buffer for free
140,000+ small businesses like yours use Buffer to build their brand on social media every month
Get started nowRelated Articles

In this article, Nupur Mittal shares insights into four research methods that help her find content ideas and identify unique takeaways.


Facebook marketing in 2019 isn’t dead. On the contrary, it’s far from it. Now removed from the dim outlook that businesses faced at the beginning of 2018, Facebook has and will remain an essential tool for brands’ marketing strategies moving forward. In our big State of Social Media 2019 Report, we found that 93.7 percent of businesses use and are currently active on Facebook — the most among any other social media network. And although we continue to see a dramatic rise in the usage