The Marketer’s Guide to Google Analytics: How to Extract Numbers That Drive Action


Admission time: I don’t know much about Google Analytics. In fact, I generally gloss over when I read anything about it, since I usually find it all quite overwhelming and hard to understand. And not that much fun, to be honest.
But, being a content marketer, I can’t afford to ignore Google Analytics. It’s a great (free!) tool that helps us keep track of our goals for the Buffer blog and understand where we can improve.
If you’re in a similar situation to me, hopefully this post will highlight some of the most useful parts of Google Analytics for content marketing, and how you can use that data to your advantage. Without being boring! At least, I’ll give it my best shot…
Note: If you haven’t installed Google Analytics on your site yet, it’s really easy. This guide will show you how to get it set up.
1. Publish content that your audience likes
We all want to publish content that our audience will enjoy and share with others (thus, growing our audience). That’s what content marketing is all about.
Google Analytics can help us out here by highlighting which of our posts are most popular and how we can shape our future content to keep our readers interested.
Here’s how I do this at Buffer:
1. Run a Behavior report
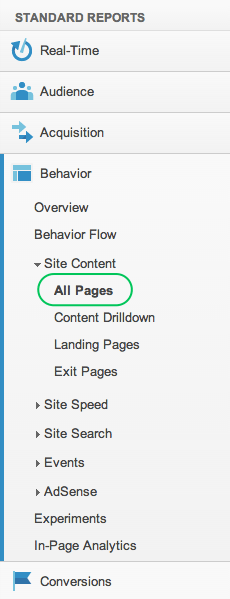
In the Standard Reports menu, click on Behavior. From the list that drops down, choose Site Content and then All Pages:
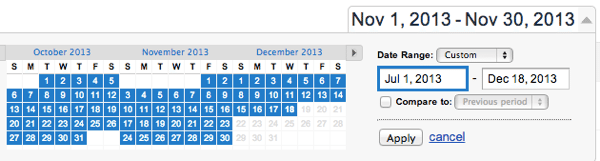
2. Set the date period
At the top right there’s a date picker where you can set the period your report is run for. I’m going to do one starting in July, covering around 6 months.
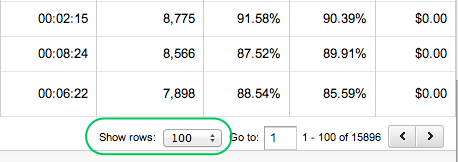
3. Set the number of rows
I want to get a good overview of what content is working on the Buffer blog, so I’m going to set the report to show the first 100 rows on a single page. You can find this setting underneath the report:
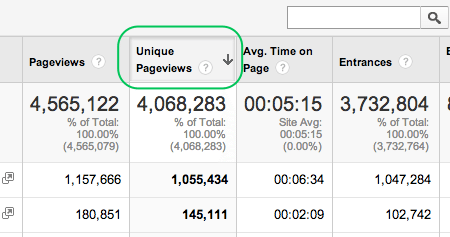
4. Sort by uniques
At the top of the report, you can choose what to sort the results by. It’s set to page views by default, but I’d rather know how many unique people have looked at each blog post, not including those that look at the same one multiple times. To sort by unique pageviews, just click on the heading and you’ll see an arrow icon appear next to it:
Now I can see what the top 100 most popular pages on the Buffer blog have been since July, and use that to make decisions about what content we should produce in the future. Here are a couple of examples of how I’d use this data:
Choosing topics
From looking at the top posts, I can see that “social media statistics“, science-backed posts and topics related to the brain and social media come up often. This is helpful in understanding what topics to focus on more.
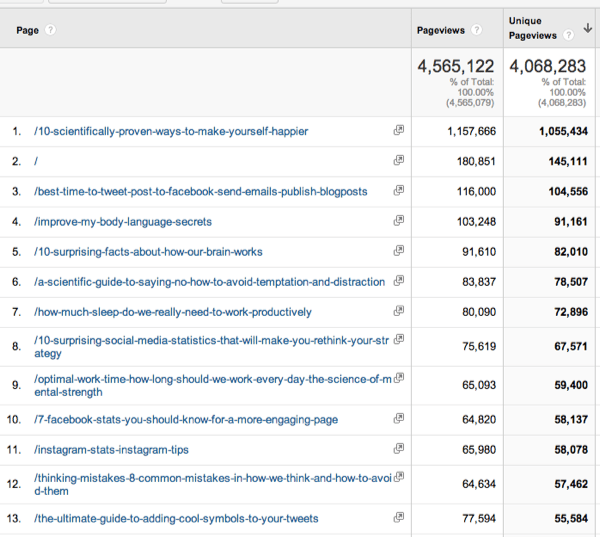
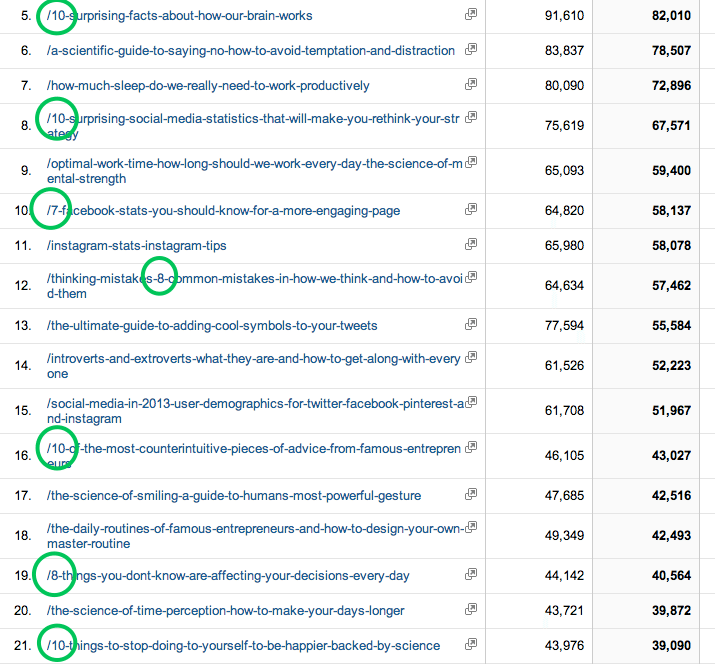
Choosing the structure of posts
I can also see that list-based posts are popular, based on the number of titles with numbers in them. This is a good reminder that listicles are easy to scan and often have something for everyone so they get shared a lot.
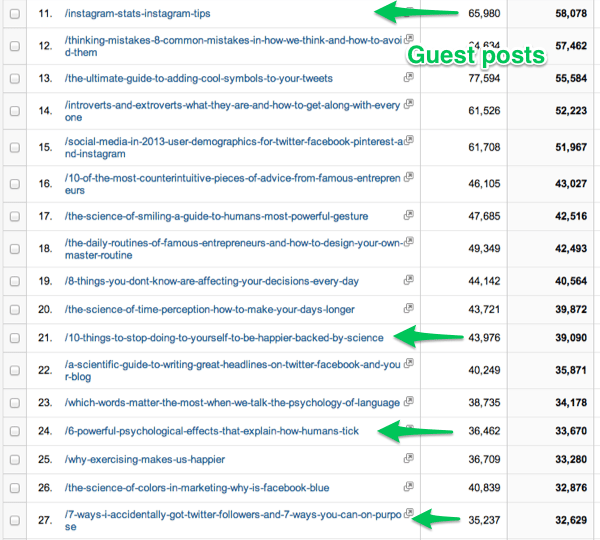
Identify post authors
Something that Google Analytics doesn’t do here is show the author of each post. Luckily, I know our blog well enough to recognise which posts are by guest authors and which ones were written in-house. Which this knowledge in mind, I can use this report to see how many guest posts are in our top 100, and whether we should keep publishing these.
Especially with the new Google Authorship, identifying authors has become more and more important.
2. Improve your visitors’ experience
Google Analytics doesn’t just give us information about the most popular content on our sites. It can also give us clues to how our site is being viewed and how good (or bad) the experience is for visitors.
Some of the areas I look at for the Buffer blog to see how we can improve the experience for visitors are bounce rate, average loading time, time spent on page and where visitors are clicking.
This is a great starting point, as it shows you how many of your visitors are leaving without visiting another page on your site. This could be for a few reasons: your site takes too long to load, they came from a search engine and your content didn’t match what they were looking for, or you might need to optimise your calls-to-action and links to related content to keep them around longer.
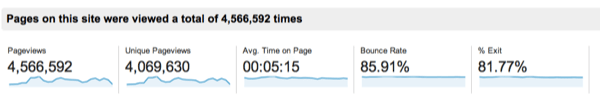
In the Behavior menu again, click on “Overview”, right at the top, and you’ll see something like this:
If you click on “Bounce Rate,” you can view a bigger graph like this:
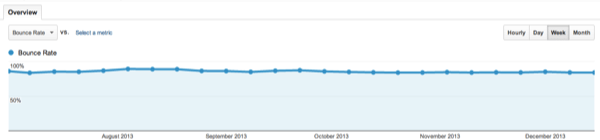
Something to keep in mind when looking at your bounce rate is that this is more important for new visitors, since they’re the ones you want to convince to hang around (as opposed to returning visitors, who’ve already made the effort to come back to your site).
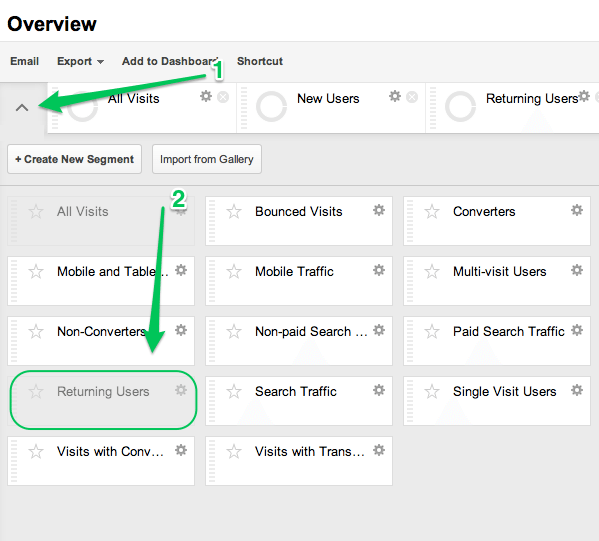
You can add segments to your analytics report which will show you the bounce rate of your new visitors vs. returning visitors.
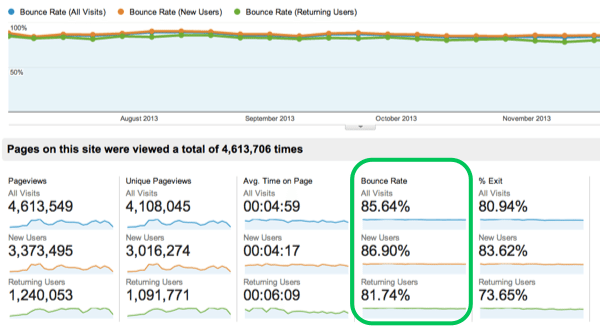
Interestingly, for the Buffer blog the comparison showed that our bounce rates are about the same for both types of visitors:
Something we’ve tried recently on the blog is adding links to two related posts at the bottom of each post, like this:
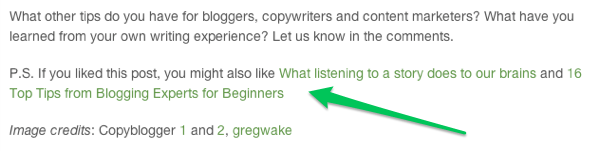
Google Analytics tells me that people are clicking on these links, as you can see below:
But they aren’t affecting our bounce rate very much, by encouraging visitors to look at more of our blog posts. This is a great thing for us to learn so that we can experiment with other ideas.
For more on bounce rates, KISSmetrics has an excellent infographic that includes tips to improve yours.
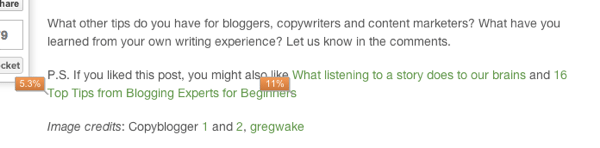
Where people click
Okay, here’s one of the more fun parts of Google Analytics that I’ve found. In-
Page Analytics lets you see your site with an overlay of bubbles to show what percentage of people click on each link you have.

When I used this for the Buffer blog, looking at all of our traffic from July this year, I found that 21% of people click on the Buffer logo at the top of our blog:
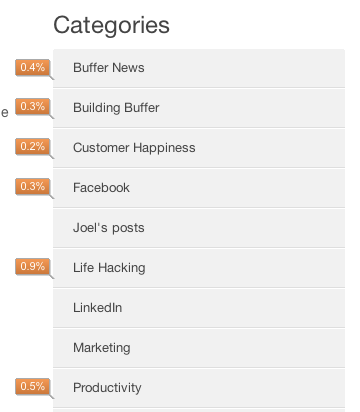
This kind of data is really useful for understanding the way visitors use your site and how to make it better. We can also see how many people click on each of our post categories, and we can use this when creating new calls-to-action or testing out a new blog design.
Especially looking at the colors in marketing for this, can have a huge benefit.
Loading time
Another neat trick of the In-Page Analytics is that it will show you how long people spend on that page on average, what the bounce rate is for that particular page, and how long it normally takes to load:
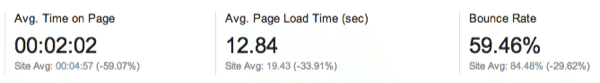
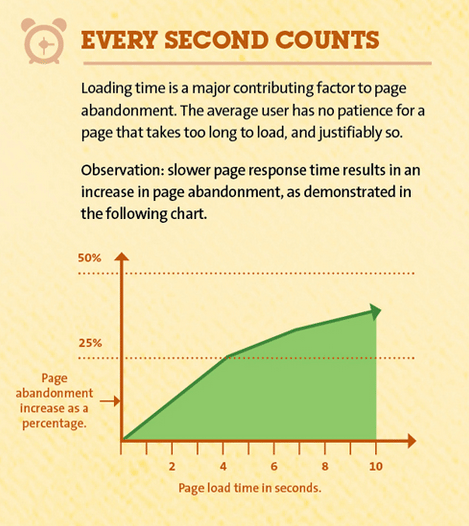
Optimising the loading time is a really important thing to focus on for your site, since just a 1-second delay can lead to a 7% lower conversion rate:
3. Focus your marketing efforts
Knowing which social networks and marketing channels to focus on can be tricky without data to back up your assumptions. Google Analytics can actually make this a lot easier by showing you where most of your referrals are coming from and what content works best for each social network or referral site.
Here’s what I found when I explored this for the Buffer blog:
Social networks
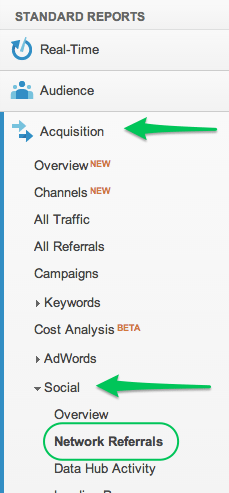
If you click on “Acquisition” in the left-hand menu, then “Social” and finally “Network Referrals,” you’ll be able to see which social networks are sending traffic to your site.
Focusing strictly on Social Media metrics and which areas of it to improve, can already give you a big boost in your results.
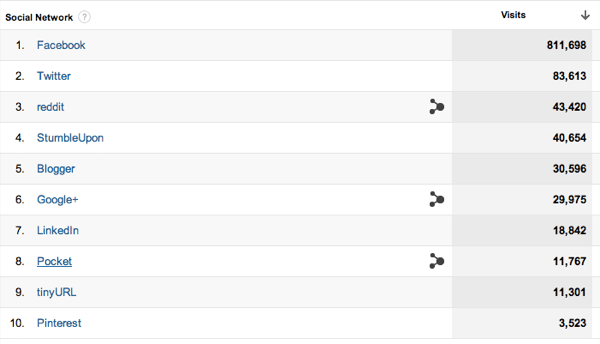
As you can see in our results, Facebook is beating other social networks by a mile:
What I really love about this section of Google Analytics is that you can also see which pages are getting all this traffic. If I click on Facebook, here are the top posts that it’s sending referral traffic to:
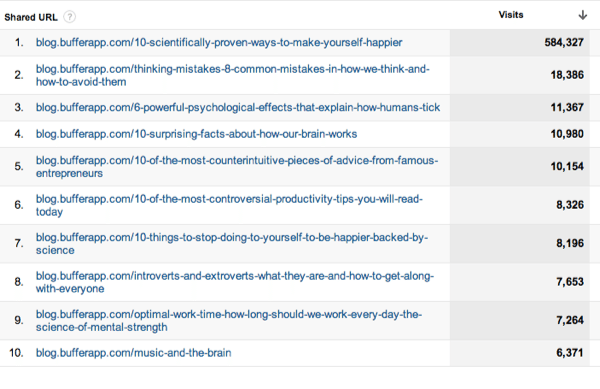
Again, there’s a very clear leader here. What’s also interesting about this report, though, is that all of these posts fall into our lifehacking, productivity and science categories. This is an indicator that social media, writing and marketing posts might not work so well for us on Facebook, so we should explore promoting those posts on different networks.
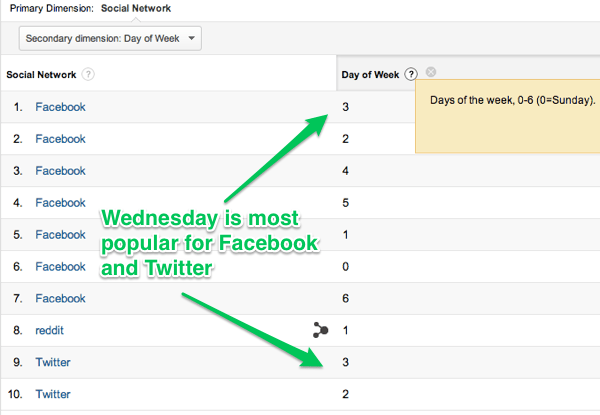
Another neat trick is that you can drill down further with the “Secondary dimension” option. There are loads of things to choose from here, but one I found really interesting was looking at the day of the week that each social network sent us more traffic:
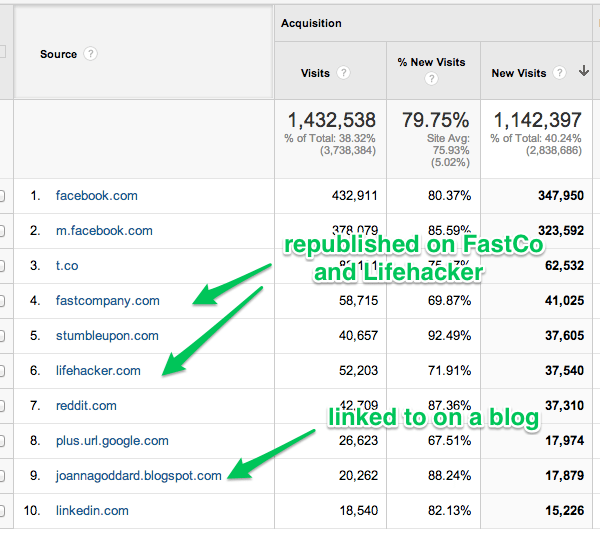
Other referrals
Of course, referral traffic comes from other sites besides social networks. We can see other referral traffic under “All Referrals” in the side menu:
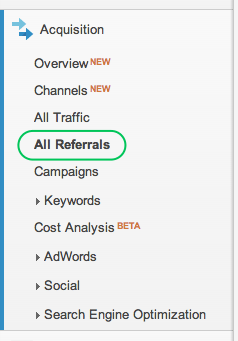
Although social networks are included in this report as well, it’s a good way to see which sites we’ve been republished on or where we’ve been linked to around the web that has sent lots of traffic our way.
I usually use this report to get the top referral stats for our monthly content reports.
Wrapping up
In case you hadn’t noticed, Google Analytics is huge. There’s so much more to discover that I haven’t even looked at yet.
But hopefully, if you find it as overwhelming as I do, this post will help you get started with just a few of the neat parts of it that can help you to make better-informed decisions about your content strategy.
Do you have anything to add? I’m sure I missed things, so please add any suggestions you have in the comments below.
P.S. If you liked this post, you might also like The Complete Guide to Getting Started with Facebook Ads and 7 Simple and Proven Tips to Increase Your Blog Subscribers
Image credits: Search Engine People
Try Buffer for free
140,000+ small businesses like yours use Buffer to build their brand on social media every month
Get started nowRelated Articles

This article looks into social media benchmarks for various industries and platforms.

A guide to the content marketing metrics that will help you measure success, plus guidance from top content marketing leaders.

In this guide, we’ll go through everything you need to know about TikTok analytics — from what metrics and insights are available to how to get all of them for free to what you can do with them to boost your growth on TikTok.