


Sharing transparently about all aspects of what we do at Buffer—pricing, salaries, fund-raising, earnings, hiring, and more—has been an amazing opportunity to connect with and learn from others. We get such great ideas and encouragement from sharing openly.
We’ve shared before about our content marketing goals, numbers, and adventures, and I’d love to continue these stories in regular blog posts here!
I’ll be sharing how we’re doing, what we’re up to, what we have planned for the future, and all the strategies and tips we’re eager to try. And I’d love to hear your thoughts and ideas, too! All is open, whether it’s thoughts on what we’re doing or stories about what you’re trying. Let’s begin. ?
Inside Buffer’s social media marketing stats
One thing I’ve noticed with social media marketing is that it can sometimes be a challenge to know where you stand. I often find myself asking, “So … is that good?” not only when looking at my own stats but also the stats of others.
Follower counts and likes/comments/shares are great numbers to have. It’s also neat to learn of the context behind those numbers–things like impressions or per-post averages.
So here’s our complete stats from February, context and everything, in the hopes that it might be helpful for you with your social media marketing.
(All stats are from the past 28 days, and comparisons are made to the 28 days prior.)
We gained 12,006 new followers for a total of 286,895 followers. 274889
We shared 379 tweets (not including #bufferchat and customer happiness) that earned a total of 60,050 total interactions.
Out of everyone who saw a tweet, 2.1 percent of users engaged with the tweet by clicking, retweeting, replying, favoriting, or following the Buffer account.
- Engagement rate – 2.1%
- Average impressions per tweet – 12,769
- Average total engagement per tweet – 311 (clicks, retweets, replies, follows, and favorites)
- Average clicks per tweet – 101
- Average retweets per tweet – 28
If you’re interested in digging deeper into any of these stats, I’m happy to share our .csv of exported Twitter analytics.
We gained 836 new page Likes for a total of 34,194 Likes.
We shared 51 posts that earned a total of 2,040 interactions.
An average Facebook post reached 1,079 people. Of these, 741 people were fans of our page, so each post reached an average of 2.1 percent of our fans.
- Average clicks per post – 21
- Average likes per post – 13
- Average comments per post – 4
If you’re interested in digging deeper into any of these stats, I’m happy to share our .csv of exported Facebook analytics.
We gained 236 new followers for a total of 4,060 followers.
We shared 18 posts that earned a total of 179 interactions.
- Engagement rate – 1.7%
- Interactions per post – 10
Google+
We gained 51,142 new followers for a total of 692,684 followers.
We shared 35 posts that earned a total of 1,325 interactions.
- Interactions per post – 37
- Clicks per post – 14
- Reshares per post – 4
- Plus Ones per post – 17
Referral traffic to the Buffer blog
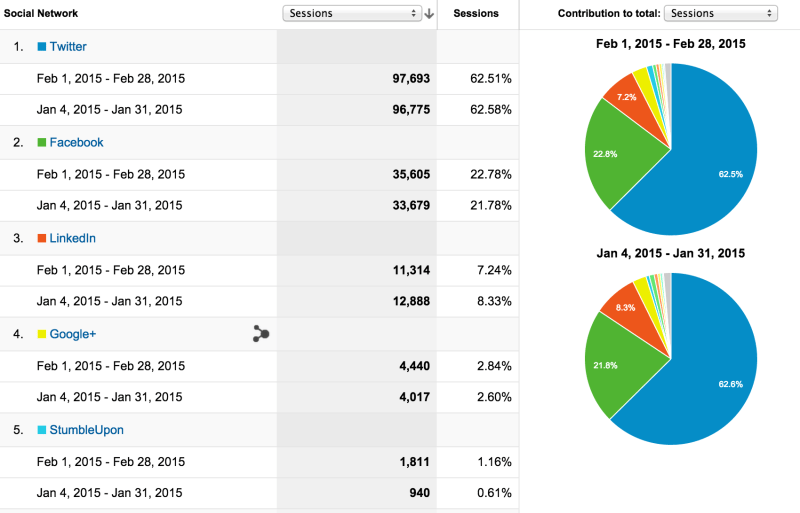
The above chart shows the top five social referrers to the Buffer Social blog. Not pictured: Pinterest was our 7th-best referrer in February, sending 900 visitors to the blog.
Referral traffic to the Buffer app
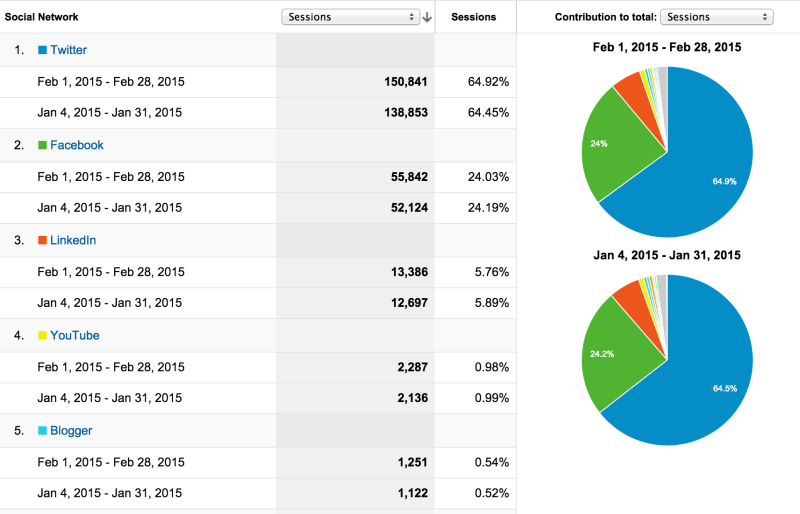
The above chart shows the social referrer traffic to the Buffer app itself. Not pictured: Google+ sent 1,100 visits, and Pinterest sent 850.
Inside Buffer’s social media strategies
Along with the stats, I’d love to share a bit about the strategies we’re testing on different social networks. It’d be awesome if you find this helpful or if this sparks any ideas for you. And it’d be great to get your thoughts in the comments on ways we could improve or grow, too!
We currently share 14 times per weekday, 10 times on weekends.
Our content strategy is a bit unique compared to other accounts and compared to the best practices for Twitter. We share 90 percent of our own content, 10 percent of others’.
The sharing schedule looks a little like this:
- New blog posts, shared multiple times over the course of the first few days since publish
- Popular blog posts from our blog archives, both on the Social blog and the Open blog
- An inspiring or motivational quote (once per day)
- A great article or story from outside Buffer (once per day)
- A retweet from someone on the Buffer team (once per day)
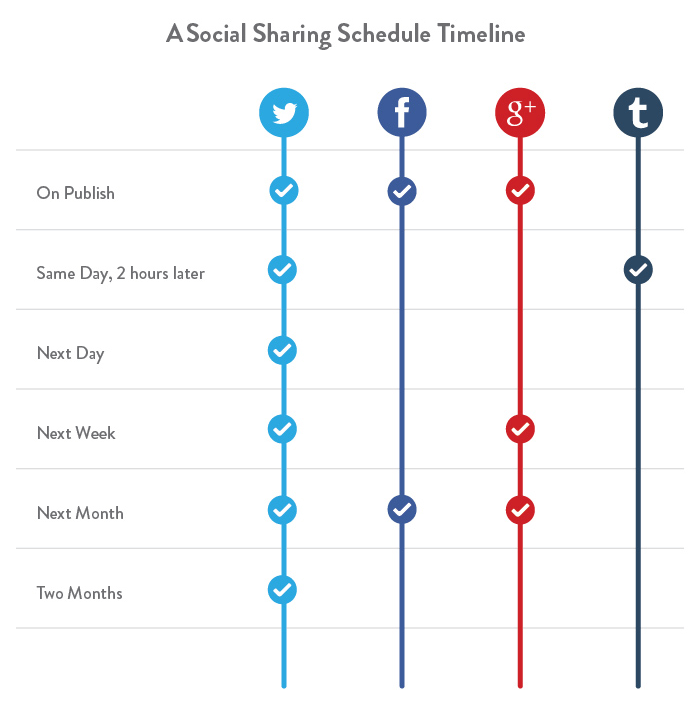
Our schedule for promoting the new blog posts is one that we’re continually iterating on. Currently, it looks like this: Share three times on day one, once on day two, once on day three, and from then on out, add to the rotation of popular posts from the archives.
It’s a similar system to this great grid from Garrett Moon of CoSchedule and KISSmetrics.
For sharing popular blog posts from our archives, we have a couple different systems set up.
- Go to an archive page on the blog(e.g., https://buffer.com/resources/page/3) and share the evergreen posts from that page.
- Re-Buffer posts from analytics. (Here’s a screen capture example.)
- Re-Buffer posts from a test account we’ve populated with popular tweets.
If you’re interested in creating a system similar to our test account system, here’s a bit more about how we’ve created this one.
- Export your Twitter analytics either from your Buffer dashboard or your Twitter analytics. (We used Buffer analytics for ours.)
- Sort the posts by the metrics that matter to you. We sorted ours by clicks. Next time, we might sort by engagement per impression (a stat available in Twitter analytics).
- Select the top group of tweets from this sortable list. Depending on your posting frequency, a list of 50 to 100 should do great.
- Save these top tweets into a .csv and upload it to your Buffer account via Bulk Buffer. The one extra note here is that Bulk Buffer will not add photos to your tweets, so you’ll need to do this manually in your Buffer queue if images are part of your Twitter strategy.
- After uploading these to your test account in Buffer, turn off the schedule for the test account so that the updates remain in your queue.
- Drag-and-drop the updates into your main Twitter account in Buffer to fill the queue there. Edit the update text as you desire!
As the Facebook News Feed continues changing, we’ve enjoyed experimenting with strategies that will make our content as useful and helpful to the Facebook audience as possible.
Our current strategy is to push ahead with video on Facebook, as we’ve identified it as one of our best ways to engage with the audience. Currently, we’re working to create short, helpful tutorial videos that share some of our favorite social media tips. Like this one from Mary:
// <![CDATA[ (function(d, s, id) { var js, fjs = d.getElementsByTagName(s)[0]; if (d.getElementById(id)) return; js = d.createElement(s); js.id = id; js.src = "//connect.facebook.net/en_US/all.js#xfbml=1"; fjs.parentNode.insertBefore(js, fjs);}(document, 'script', 'facebook-jssdk')); // ]]>
The response has been great so far. Our video posts on Facebook receive on average 1,500 people reached, which is 50 percent more than average.
In addition, we’re also interested in a couple of News Feed elements that could affect the way we share.
1. Photo posts on Facebook are the least-viewed posts.
A study by Socialbakers found that a photo post earns the smallest reach out of all post types by Facebook pages. The new number one post type is video.
- Video – 8.71% organic reach
- Text-only – 5.77%
- Link posts – 5.29%
- Photo – 3.73%
This research has been key to our focus on video content for Buffer. We’re excited to continue on in that direction, and we’re beginning to post fewer and fewer photo posts to our Facebook page. In the last three weeks, we shared 7 photos and 23 links.
2. Content shared more than once may limit its visibility in the News Feed
One of our interesting findings when researching the Facebook News Feed algorithm was that frequently circulated content may be de-emphasized in the News Feed.
In our case, we often repost evergreen blog posts from our archives, and we’re interested to understand what kind of effect this might have on visibility. Does sharing the same link more than once mean a lower likelihood of reach? Is there a better way to share helpful snippets from the same blog post?
(One sidenote on a question that seems to come up often for us: We’ve yet to go all-in with Facebook Ads. I think I’ve personally held us up from exploring this one too deeply as I’m quite keen to get organic Facebook reach figured out. I’d love to hear any stories from you on how Facebook Ads have worked!)
LinkedIn & Google+
We’ve not taken as active a role in marketing to these networks as we would like. There are certainly lots of neat ideas here (see below for more on what we’re dreaming about), and we’d love to hear what you’re trying out.
We share once per weekday to LinkedIn.
We share twice per day (weekends included) to Google+.
Of the two networks, we’ve tried the most experiments with Google+. Over the past several months, we’ve increased our publishing frequency to five times per day and written longform updates—mini-blog posts, really, of 50 words or more. Both strategies were fun to try yet ultimately did not show the increases we hoped.
Perhaps the strategy that seems to have worked the best is sharing Google-related content. (We’ve noticed the same to be true at other social networks as well.) Some of our most popular Google+ posts have referenced the Google homepage, Google’s corporate strategies, Google+ tips, and SEO.
The following post earned 1,848 clicks whereas we typically get 14 clicks per post.
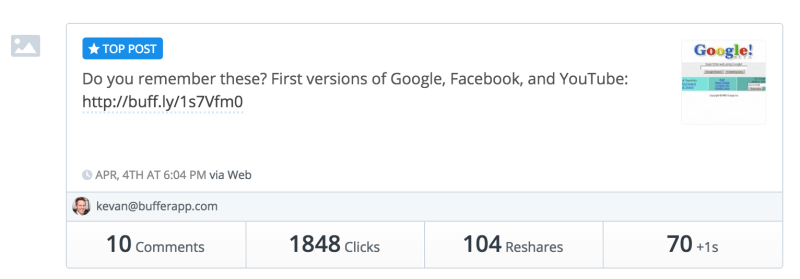
Pinterest & Instagram
We’re excited to dig deeper into these social networks in the coming months (as well as exploring new-to-us networks like Snapchat or Tumblr). Here are a couple of our favorite strategies we tried out in the past.
On Pinterest, perhaps our most active board is the one for What Buffer Is Reading. Nicole shares the book choices of the Buffer team so that others can follow along with our reading adventures. It’s part of what might ultimately become a Buffer book club (it’d be great to hear any of your thoughts on that!), and it serves as a nice place to direct people who are interested in what we’re reading. We also created a special board for the 50 most influential books for Joel.
On Instagram, each of us took a turn sharing a #weekinthelife of a Buffer teammate, wherever we were and whatever was going on that week. It was a neat way to take a peek into the lives of a remote work team, and it added some really great variety to the account.
New visions and ideas for social media marketing
We feel grateful for the chance to work on so many amazing and fun social media strategies, and we’ve got even more that we’d love to try out. Here are a few that we’re thinking over.
Create a LinkedIn group
The potential of LinkedIn seems to be growing (it’s an awesome source for a very targeted group of social media influencers and users), and one of the neat ways to be engaged there seems to be with groups. It feels like Buffer might have an opportunity to establish a great presence and influence with a group led by Joel or Leo, especially based on the connections they’ve been able to form.
Get 100k followers on Facebook
I’m quite intrigued about what goes into growing a Facebook following, and it seems like we might have a lot of growth potential to take our Facebook page from 34,000 likes to something crazy like 100k or 1 million!
At the same time, I’m hoping to be conscious of what Facebook growth might really mean for us. Is it growth for the sake of growth? Is it valuable to have 100,000 followers if we’ve yet to fully figure out the best way to reach them or to figure out how they fit with Buffer’s funnel? These are some questions I’ll be mulling.
Create a social media research study based on Buffer data
Would you all be interested to learn the best times to tweet, based on data from real Buffer users? We’d love to share any takeaways from studying the raw data of Buffer. I think next steps for us are ensuring we’ve got a great research process in place (to help the info be as solid as possible) and to have a great way to display it so you get the most value.
Social media content we’d love to write about (any thoughts?)
And finally, I’d love to share a few of the social media blog post ideas we’re considering for the next few weeks. If any of these topics jump out at you, I’d love to hear your votes!
- How to Create a Social Media Report and Explain it to Your Boss or Client
- The Delightfully Short Guide to Social Media ROI
- The Ultimate Social Media Glossary of Need-to-Know Terms
- 13 Original Ways to Use Medium for Marketing
- How to Create Shareworthy Twitter Visuals
- What $5 Per Day Will Buy You on Facebook Ads
Over to you
Thank you for letting us share a bit about our social media strategies here at Buffer. I hope the added info with our stats might be useful for your sharing and planning.
Did you see any strategies here you’d like to try out? What has been your experience with Facebook video or Twitter frequency?
I’d love to hear your thoughts in the comments!
Image sources: The Noun Project, Blurgrounds, Unsplash, KISSmetrics
Try Buffer for free
140,000+ small businesses like yours use Buffer to build their brand on social media every month
Get started nowRelated Articles

This article looks into social media benchmarks for various industries and platforms.

A guide to the content marketing metrics that will help you measure success, plus guidance from top content marketing leaders.
In this guide, we’ll go through everything you need to know about TikTok analytics — from what metrics and insights are available to how to get all of them for free to what you can do with them to boost your growth on TikTok.