
Inside Buffer’s Social Media Strategy: Stats and Key Takeaways for Marketers


Wow, how time flies! It’s been just over a year since we shared a behind-the-scenes look at Buffer’s social media strategy and stats
The feedback from the community on that post was amazing, and we learned so much from the comments, many of which ended up shaping future Buffer articles like “How to Create a Social Media Report and Explain It to Your Boss or Client” and “What $5 Per Day Will Buy You on Facebook Ads.
Since then, we’ve tried our best to learn about what’s working well for us on social media and what’s not. Some of these discoveries led us to change directions on particular social platforms, drop others entirely, and experiment with new ideas and strategies along the way.
Now that we’re nearing the end of Q1 of 2016, we thought it would be a great time to share our latest social media stats, what we’ve learned, and what our strategies look like for the future.
We’d love to hear your thoughts and ideas as we go along, too! We’re super excited to share our social media journey with you.
Let’s dive in!
Buffer’s current social media stats
One of the most challenging things for us at Buffer is to truly measure how our social media is performing.
On one hand, there are quantitative data such as clicks and shares which is invaluable in gauging overall performance and on the other hand, there’s qualitative data that’s a little harder to measure. For example, determining the value of a comment compared to a like or a retweet compared to a share on Facebook.
Which raises the question: What should we be measuring and what’s not so important?
In hopes of answering this, we’ve found that it’s useful to start with what we want to achieve first, and then work our way back from there. That provides context around the numbers that are important to our marketing team and how we can go about measuring them in an effective way.
- For example, if one of our primary goals was to build an audience to a certain size by a certain date, then we would measure data that are directly related to audience growth such as an average number of likes per week and an average number of shares on our content.
With that in mind, here’s a complete audit of our social media stats from February, including how we pulled the data, what we learned, and our strategy for the future based on the numbers.
We broke the 50,000 Fans mark on February 29th, and so we’d like to start by thanking our awesome Buffer community!
To pull a detailed report of our Facebook page performance we went to: Insights > Export > Page Data & Post Data.
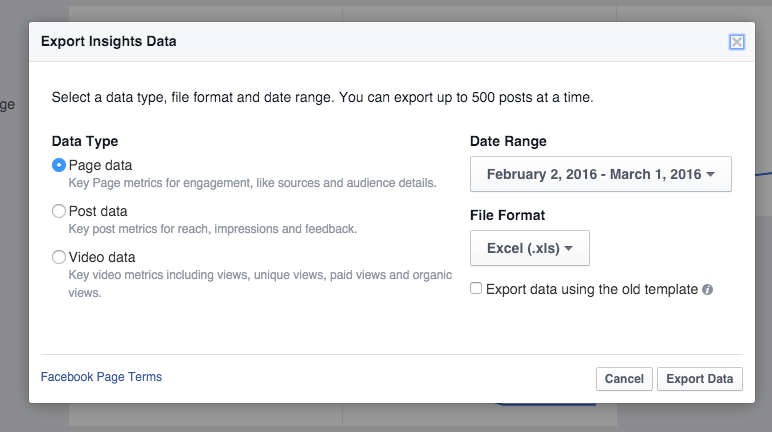
After clicking “Export” users end up with a data sheet similar to this one: Buffer Facebook Page Data – Feb, 2016
We gained 3,007 new page likes for a total of 50,106.
We shared 86 posts (72 links, 12 photos, and 2 videos) earning a total of 207,203 in “Organic Reach” and 190,155 in “Paid Reach”.
- Average clicks per post = 180
- Average likes per post = 43
- Average comments per post = 5
We averaged 731 “Daily Engaged Users”.
We averaged 10 “Page Unlikes” Per Day.
Posts that contained “Links” accounted for 8/10 of our top-performing posts in terms of “Reach” with the remaining 2 being “Photos”.
What we’ve learned and our strategy for the future
As Facebook continues to grow and evolve, we’re keen on adjusting our strategy to grow and evolve with it so that we may provide content that is as useful and fun.
- Paid strategy – A quick glance at the numbers shows that nearly half of our total Reach on Facebook in February was attributed to “Paid” – that’s huge! We’d like to continue to experiment with advertisements and boosted posts as we have seen success with both in terms of traffic to our blog and overall engagement rates.
- Experiment with different content – Another interesting fact in the data is that we share a lot of links compared to other sorts of content like photos, Facebook Live videos, GIFs, infographics, and more. A closer look shows that photos accounted for 2/10 of our top-performing posts in February, but we only posted 12 photos compared to 72 links. We’re looking forward to trying new posting tactics in the coming months and measuring their success in relation to clicks, shares, audience growth, comments, and blog traffic.
- Focus on Page growth – One of our key OKRs for Q1 of 2016 is to grow our Facebook page audience size to roughly 100,000 fans (currently 50,106). We’ve fallen a little short – which turned out to be a great learning experience for us. This month, we’ll be working on strategies such as involving our Buffer Community more in the content, cross-channel promotion, increasing employee sharing efforts, and potentially social media influencer program.
One of the fun things that we like to experiment regularly with at Buffer is the number of times we post to Twitter each day and what sort of content we post. We call them growth hacks or mini-experiments, and it’s amazing to see how the data changes week-to-week, even day-to-day!
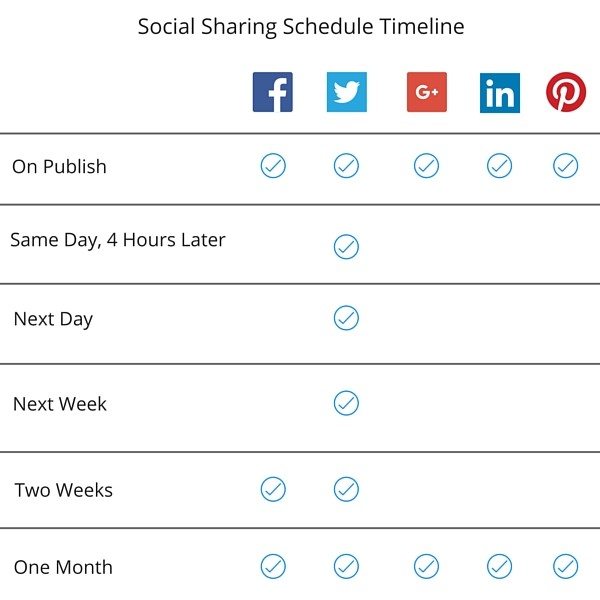
Here’s a look at what our Twitter posting strategy looks like as of today:
We post 13-15 times per day (20–23 on Tuesdays/Wednesdays with #bufferchat)
We post 93% of our own content, 5% curated content, and 2% retweeted content from the Buffer Team. Content includes:
- New & evergreen blog posts from our Open Blog, and Pablo by Buffer
- Celebration of holidays
- Pictures from our team and/or community
- Twitter polls aimed at receiving particular feedback or just for fun
- Information on how to use Buffer, Pablo, or Reply
- GIFs!
One thing to note is that we love to share content more than once on Twitter as the feed tends to move quite fast. We’ve found that we don’t see a huge drop off in engagement, even after the second or third share.
Garrett Moon of CoSchedule also found similar results and noted that when CoSchedule experimented with posting the same content multiple times to social media, he didn’t receive any complaints about the additional posts. In fact, sharing a variation of the same post three times in one week resulted in double the traffic to the website.
In a blog post on KISSmetrics, Moon explains: “Sharing more than once is an essential part of providing your audience with the value you promised them. If you don’t share your links a few times, they may never see any of your updates.”
In order to pull the data reports on our Twitter performance, we often love to use the analytics tool that Twitter offers, in particular, to get the impressions data for our tweets. To find your analytics report, head on over to the “Analytics” tab under your profile picture drop-down menu.
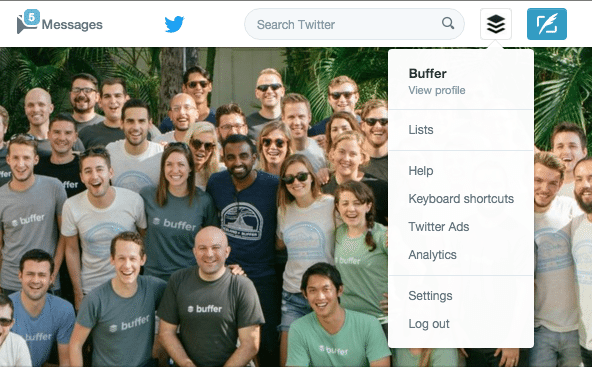
From there you’ll get a snapshot of the overall performance of your Twitter account. You may also dive deeper by exporting the data to Excel within specific timeframes.
We averaged 14.3 tweets per day, earning us:
- 410,000 unique impressions per day
- 136,000 profile visits
- 31,600 link clicks
- 11,400 retweets
- 24,100 likes
- 5,500 replies
What we’ve learned and our strategy for the future
- Have a little fun with Twitter – What we mean by “fun” is that we’d like to make an effort and be more timely with world & local events – joining in on important conversations and interacting with audiences from around the globe. For example, participating in #InternationalWomensDay or #SXSW on social media and contributing in meaningful ways. Then, we can measure impressions and engagement on these sorts of tweets vs. standard Buffer tweets.
- Continually run mini-experiments – The Twitter feed moves extremely fast which gives us the opportunity to try new things and use the data to hone in on the activities that are driving real growth on Twitter. For example, testing images vs. text only or curated content vs. original content from the Buffer Blogs. We’ve also been experimenting with Twitter Polls and using that information to drive future social media and content ideas.
Instagram is a channel that we’ve recently started to put a great deal of effort behind. We’ve found that it receives a slightly higher engagement rate per post (5–10%) as opposed to other mainstream social channels and it gives us an opportunity to give everyone a fun and unique look into our Buffer team and community.
In order to pull free reports on the performance of our Instagram account, we’ve had to get a little creative. Much of it requires manual labor like comparing follower growth counts week by week, determining the average number of likes and comments per post, and measuring traffic to our blog.
However, there are some great tools out there such as Iconosquare and Simply Measured that provide free trials and basic reports for social media marketers (and detailed reports for those who opt for the paid versions).
(Update: We now also have Buffer Analyze that can help you make better decisions about your social media strategy and measure your results without feeling overwhelmed.)
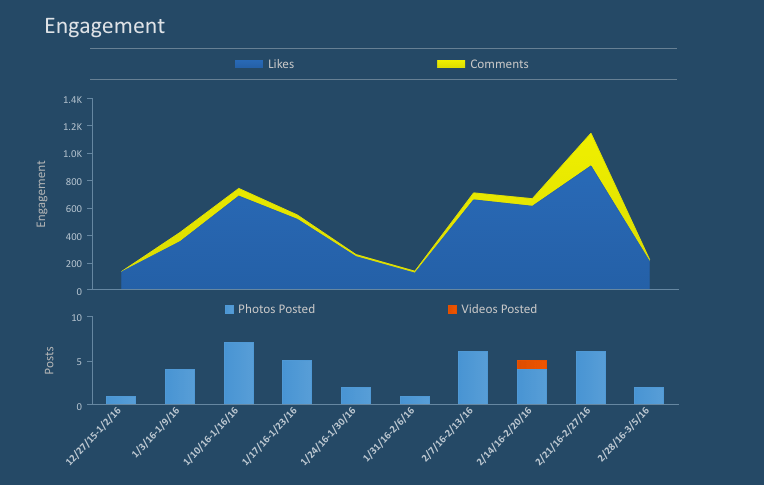
A look at our stats based on free reports + manual labor:
- <23 photos posted
- Avg. 105 likes per photo
- Avg. 13 comments per photo
- Avg. 56 new account likes per day
What we’ve learned & our strategy for the future
- Experimentation – We’re having a lot of fun experimenting with different strategies at the moment – everything from post frequency and types of photos to contests and Buffer community “guest posts.” We’re also keen to understand the most optimal times of day that our posts perform best and which hashtags are associated with which top-performing posts.
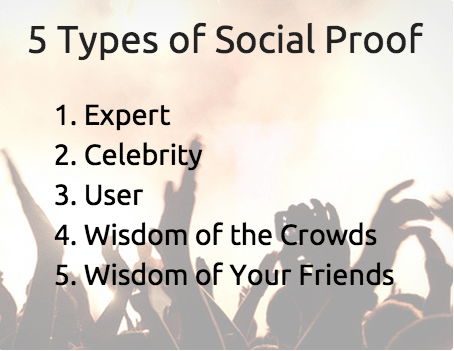
- User-Generated Content (UGC) – We’re currently testing out a UGC strategy and measuring the effects of social proof on Instagram growth. We’ve been diligently monitoring, following, and engaging with Buffer users within the social media sphere. When we find a community member that meshes with our vision and Buffer Values, we reach out to them and ask if we may share a photo of theirs and tell their story on social media.
- Contests and giveaways – Asking our audience members to actively participate in Buffer contest has been a big driver of growth and engagement for us in the past three weeks. We’re currently collecting the data on those campaigns and will share those results with you in the near future! A key takeaway for us so far with contests is that the easier it is to enter, the more people who will participate. Something as simple as telling a story with only emojis has worked really well so far.
Snapchat (@buffersnaps)
Excited to say that we’re just getting to know the ghost here at Buffer, and so far it’s been a fun and interesting journey. We launched our Snapchat account on February 23rd and haven’t looked back since! Similar to Instagram, we’re getting creative with how we measure our success on Instagram – Here are the stats we’re keeping track of:
- Snapchat “Score” of 225 (based on how many Snaps you send and receive)
- Avg. 85 views per Snap
- Avg. 15 Snaps to our “Story” per week
- Avg. 6 messages sent and received per day
- Avg. 10 new followers per day
What we’ve learned & our strategy for the future
Snapchat is a unique network in the sense that it’s a challenge to measure the direct impact on other marketing goals such as audience growth and blog traffic. We’re really interested to know how that will change over time as Snapchat grows and evolves.
There’s also something to be said for Snapchat engagement levels being through the roof. We have roughly 200 friends on Snapchat and receive 85 views on each post – that’s a 42% engagement rate!
Our strategy with Snapchat moving forward will be a mix of both social media thought leadership content and sharing an inside look into the lives of our Buffer team members with the Buffer Community.
If you’d like to join us on Snapchat, add @buffersnaps or scan the Snapcode below:

Google+, Pinterest, LinkedIn, and our newest venture Anchor
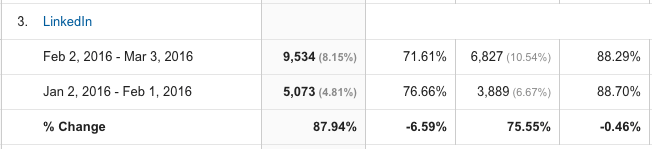
Of the three networks, we’re really starting to focus on LinkedIn as a major growth channel for Buffer. In the past, we’ve posted once per day during the weekdays, but in the last few weeks, we’ve ramped that content up to three times per day during the week and once per day on the weekends. Here’s what we’ve seen as a result (data pulled from Google Analytics and LinkedIn Page Analytics):
2/1/16 – 2/16/16
- Total Posts: 19
- Total Clicks on Post: 850 (Avg. 44 clicks per post)
- Total Interactions: 382 (Avg. 20 interactions per post)
- Total Traffic from LinkedIn: 3,930 visits
2/15/16 – 2/29/16 (Date range in which we increased our posting frequency)
- Total Posts: 35
- Total Clicks on Post: 2,028 (Avg. 57 clicks per post)
- Total Interactions: 972 (Avg. 29 interactions per post)
- Total Traffic from LinkedIn: 5,127
We post to Google+ twice per day but honestly could do a better job of nurturing relationships on the channel as that’s what it’s great for – building communities. Google+ is currently driving around 3,000–5,000 blog visits per month and so we’re focusing on ways to optimize our efforts while being time-efficient.
Pinterest is a channel that we’ve gone up and down with in the past as we struggle to find a niche. As with LinkedIn, we’re increasing the number of original posts per week (10–12) and are making a concerted effort to pin awesome content from around the Pinterest community.
Anchor is an interesting up-and-coming iOS app that is making waves across social media. We’re exploring ideas of releasing mini podcasts to Anchor on relevant topics in social media and start-ups. The fun thing about Anchor is that it is very community-focused and encourages voice replies… something we love here at Buffer.
Over to you
We made it! Thanks for reading along with us.
We hope that a look into our social media strategy and stats will help provide you with awesome new ways to measure data and will spark some amazing ideas for your own social media strategy.
Key Takeaways for our Social Media Strategy Moving Forward
- Consistency
- Usefulness
- Experimentation
- Measurement
- Community
- Support
Do any of these key takeaways resonate most with your social media strategy? Are there any social media channels or tactics that are working particularly well for you? We’d love to hear from you in the comments!
Try Buffer for free
140,000+ small businesses like yours use Buffer to build their brand on social media every month
Get started nowRelated Articles

This article looks into social media benchmarks for various industries and platforms.

A guide to the content marketing metrics that will help you measure success, plus guidance from top content marketing leaders.
In this guide, we’ll go through everything you need to know about TikTok analytics — from what metrics and insights are available to how to get all of them for free to what you can do with them to boost your growth on TikTok.