
What We Learned Analyzing 595 Buffer Blogposts: A Complete Content Audit and Spreadsheet Template


Former VP of Marketing @ Buffer
The very first Buffer blog post—Want to Tweet While You Sleep?—was published in January 2011.
Three-and-a-half years and 595 posts later, we’ve covered a lot of ground, learned a huge number of tips and tricks that make social media easier, and written a ton of helpful, actionable content.
Many others have just as much—probably even more—awesome content sitting in the archives. If you’re just starting out, you’ll get to this point, too. When your archives are bursting with content, it could very well be time for a look back to see what has worked and what could be made even better.
We ran a content audit on the Buffer blog and came away with several key action items and quick wins that we’re excited to implement. Let me show you how we did ours and some of the helpful takeaways we learned.

How to run a content audit on your blog
Before you get to the takeaways, you first need to grab the data. This involves running a handful of reports, and placing the results into a spreadsheet. Here’s how we created our master file of Buffer blog content.
1. Run a Screaming Frog analysis of your blog
The free Screaming Frog SEO spider will pull out all the relevant pages that are indexed on your blog. Download the software and run the report, and you’ll get a data file that you can easily upload into Excel or Google Drive.
Screaming Frog analyzes each of your pages and returns a host of valuable information on the specifics of each page. Here’s what I found most helpful.
- URL
- Title
- Title length (in characters)
- Meta description
- Meta description length (in characters)
- The major H1 and H2 headings on the page
- Word count
2. Filter out all links that might not be necessary for your audit
The Screaming Frog results were incredibly detailed, which meant there was more information than I really knew what to do with. So I sorted and filtered to get what I needed.
For example, Screaming Frog returned results for all the images and files we had uploaded to WordPress (since each image and file has its own url). I chose to filter these results out so that I would only see the blogposts in the spreadsheet.
To do this:
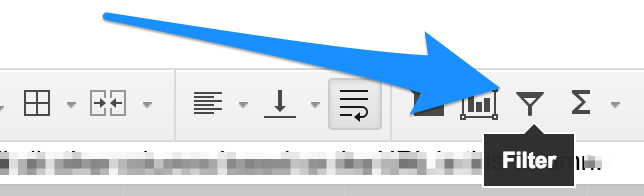
Select all cells.
Click the Filter icon.
Go to the Address column of your spreadsheet. Click the filter icon at the top of the Address column.
Search for the phrase “wp-content” (which appears in the url of all uploaded files in WordPress).
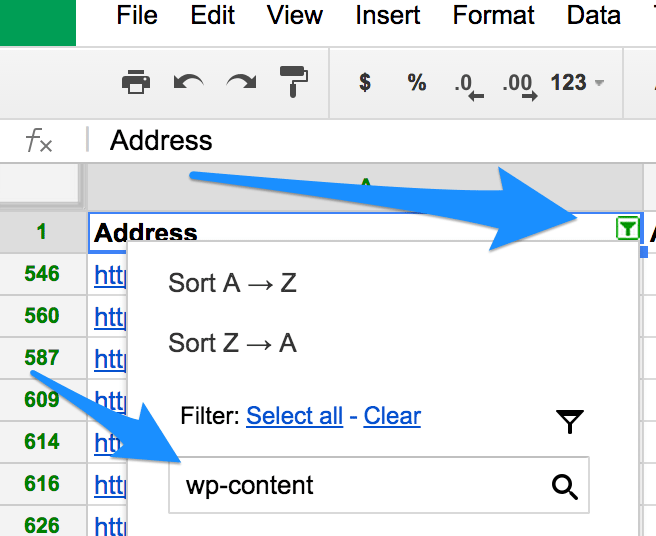
Click “Clear.”
Done! All urls that contain “wp-content” should be removed from the view. (They’re all still in the spreadsheet, just out of sight for now.)
3. Input all URLs into Shared Count‘s bulk uploader, export, add to spreadsheet
Now that you have all your relevant blogpost pages in view, select all the urls in the Address column and copy them to your clipboard.
Head over to Shared Count and click on the URL Dashboard from the top menu. We’ll be adding all the URLs we copied into the Shared Count bulk uploader.
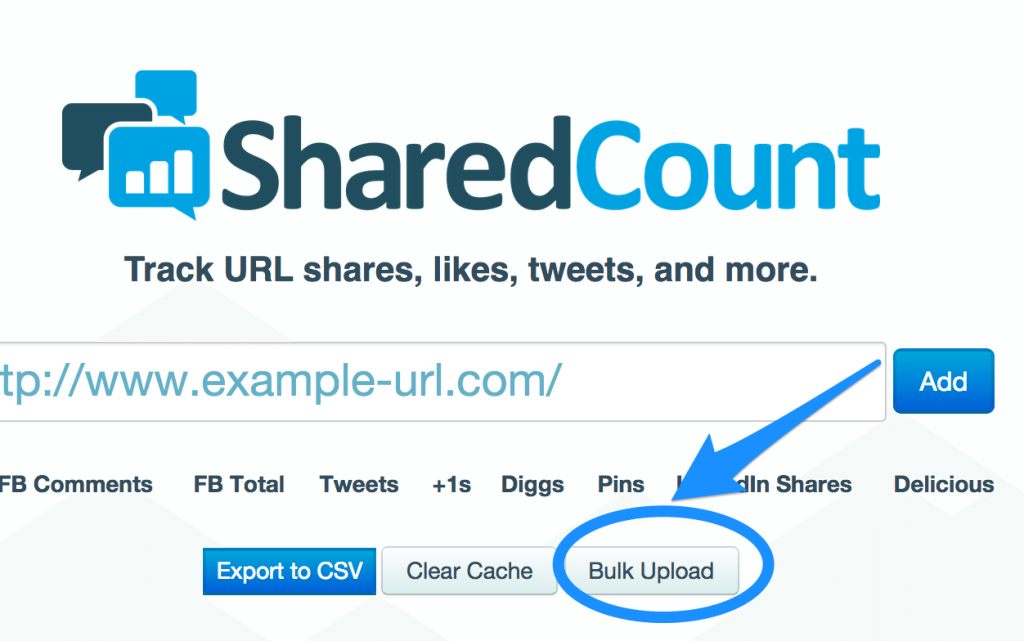
Once these URLs have been uploaded, you can run Shared Count to see the results. At the bottom of the results page is an option for exporting these results to a file.
Take this exported file and import into your spreadsheet.
You can match up the imported data with the correct rows in a couple of ways.
- Copy and paste. Ideally the data you grabbed from Shared Count should be in the same order as your spreadsheet.
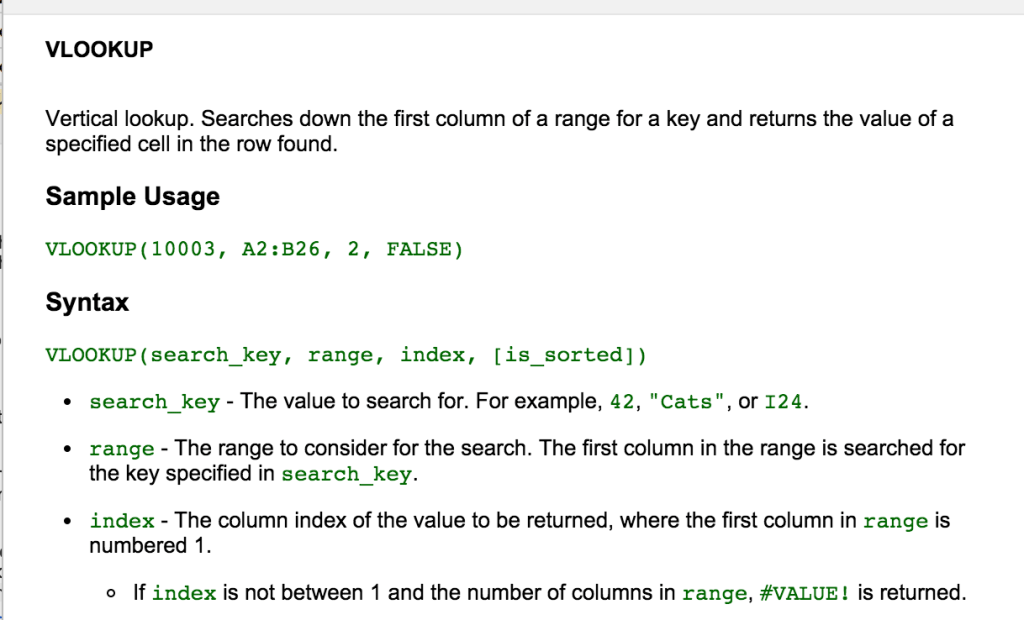
- Run a VLOOKUP to find the data.
There are some great tutorials on exactly how VLOOKUP works. Basically, you’re telling your spreadsheet to look for a certain value (the URL) in a selection of cells (the imported data), and if the spreadsheet finds that value (the URL), it should return the corresponding value from the cell you specify (the URL’s Facebook shares, for instance).
Here’s a bit more from Google Sheets on the topic:
When the Shared Count information is entered into your spreadsheet, you should have the following data for each URL:
- Facebook Likes, Shares, Comments, and Total Engagement
- Tweets
- +1s
- Pins
- LinkedIn Shares
- StumbleUpon
(Reddit, Digg, and Delicious columns were empty when I ran the tool, so I deleted them from the spreadsheet.)
4. Grab Google Analytics data
Google spreadsheets has a neat integration with your Google Analytics data. You can run reports from right within your document and then carryover the resulting data to your main sheet.
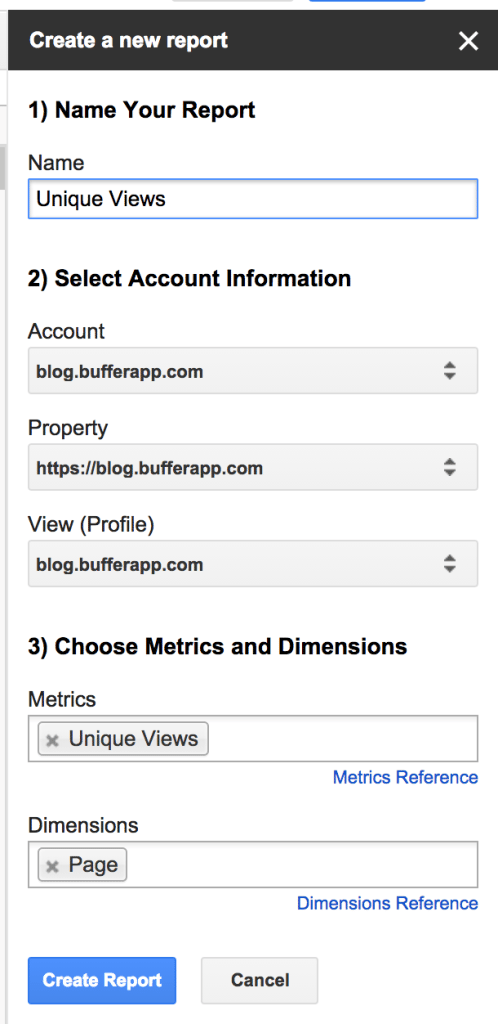
In Google spreadsheets, go to Add-ons > Google Analytics > Create a New Report.
This will bring up a dialog box where you can set the basics for your report. I pulled in a pair of reports for this content audit.
- Unique visits
- Time on page
When creating the report, you can put your desired data in the Metrics field and the associated page in the Dimensions field. Here’s an example:
Once the initial reports are made, you can refine your results with filters and maximum results.
Filters: Tell Google to only show results that meet certain criteria.
For instance, if you only want page results that received 500 or more unique pageviews, you would add this bit to the Filters section on the Report Configuration tab: ga:uniquePageviews>500
Max results: Enter any number here, and Google will only return this certain number of results.
When you’re ready to see the data, click on Add-ons > Google Analytics > Run Reports. This will create two new tabs with report data. You can run the VLOOKUP function to add this data back into your content audit table.
5. Pull in some keyword and search data
Some of the best tools out there for this kind of data come with free trials or plans to get you started. Here are some to consider:
In general, the results of these SEO tools will mostly look the same. We ran the Buffer blog through SEM Rush and Moz for our audit. What was hugely helpful to see from this data was how some of our blogposts ranked in search results pages and which keywords were best.
Here are the key data points I added back into our audit spreadsheet.
- Keyword
- Position
- Search volume
- Pagerank
- Inbound links
With this data, I could see which posts were ranking for keywords, how high they were ranking, and how significant the keyword was in terms of traffic.
To pull these numbers into the spreadsheet, I ran a VLOOKUP for each blogpost URL. One of the limitations with VLOOKUP is that it is only capable of returning one result. So for blogposts that ranked for multiple keywords, I wasn’t able to grab that data. If anyone has ideas on how to improve on this, I’d love to hear in the comments!
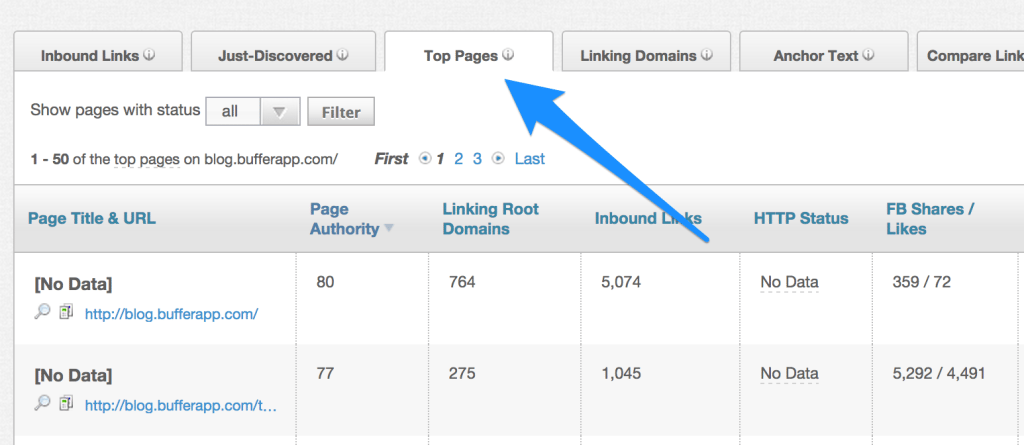
Additionally, with a free trial at Moz, I was able to grab full data on the Buffer blog via Open Site Explorer. Specifically, I exported the data from the Top Pages tab, uploaded to my spreadsheet, and ran VLOOKUP to pull in the appropriate data for each page.
6. Add the day of the week that each post was published
Credit to Matthew Barby for this really cool tip. You can import the publish date for each of your posts by using a slick formula called XPath. This formula basically searches your page for an element you specify and then returns the result.
=IMPORtXML($A3,”//span[@class=’timestamp’]”)
The //span[@class=’timestamp’] portion is the XPath.
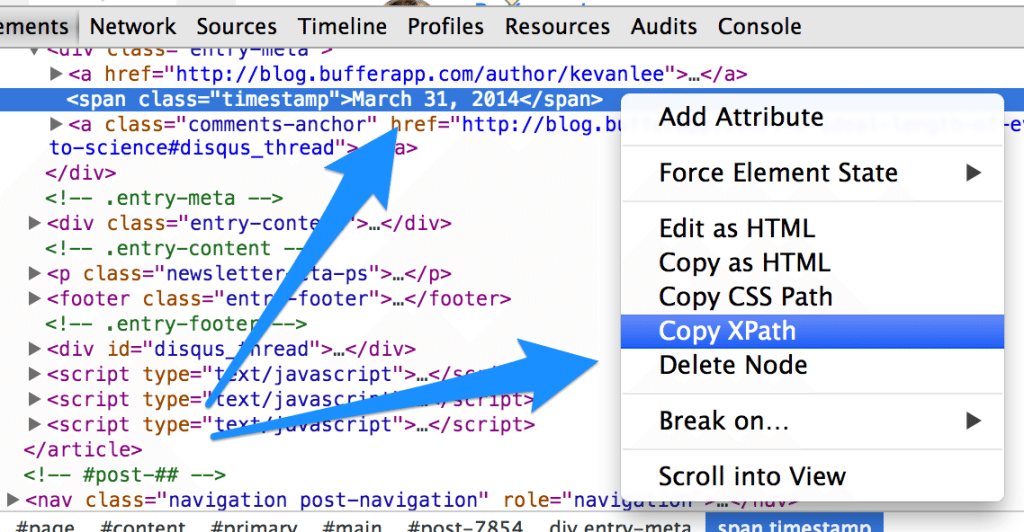
Here’re the instructions from Matthew on how to grab the XPath from your page:
All I did was find where the category is displayed within an article, right-clicked (within Chrome) and selected inspect element. On the line of code that is highlighted within Chrome Developer Tools (i.e. the line of code displaying the category name), I right-clicked and pressed Copy XPath.
Another way I’ve found to grab this information is to enter the CSS class name into the XPath field. For instance, in the example above, our publish date is wrapped in a “timestamp” class. So “timestamp” is what I use in the XPath formula.
=IMPORtXML($A2,”//span[@class=’timestamp’]”)
Once the date is entered, you can run another quick formula in a new column to have Google spreadsheets find the day of the week from the date.
=CHOOSE(weekday(A2), “Sun”, “Mon”, “Tue”, “Wed”, “Thu”, “Fri”, “Sat”)
What we found with our content audit
Running an audit like this can be an eye-opening experience, no matter the results. It’s a similar feeling to planning a content calendar: You get to pick your head up from the daily writing, editing, and publishing, and see your blog from a different perspective.
Keyword insights were fascinating. It’s really great to see which posts are ranking for which keywords—and to learn from what we did well on those posts.
Comparing the success of not only your recent posts but also your posts all-time is a great learning experience, too. Our content audit gave us data from more than three years ago, which I had yet to consider.
And of course seeing all these numbers and figures highlighted some areas where we can grab some quick wins.
Here are some specific takeaways we got from our content audit.
What you can do with the results
1. Compare lengthy posts to shorter posts
Which get shared more?
Our content audit has given us all the data needed to find this. We’ve just got to run a couple quick calculations. First is to place the word count data into a handful of buckets. Here’re the ones I chose:
- Fewer than 500 words
- 501 to 1,000 words
- 1,001 to 1,500 words
- 1,501 to 2,001 words
- 2,001 to 2,500 words
- More than 2,500 words
To get these buckets, I ran a quick “if > then” formula that looked like this:
=IF(A2<500,”up to 500″,IF(A2<1000,”up to 1000″,…))
Then I went to Data > Pivot Table Report and created a pivot table from the data. When choosing the range and data to manipulate, I added the word count bucket column into the Columns field and the Total Social column into the Values field, making sure to summarize by Average.
Here is the result:
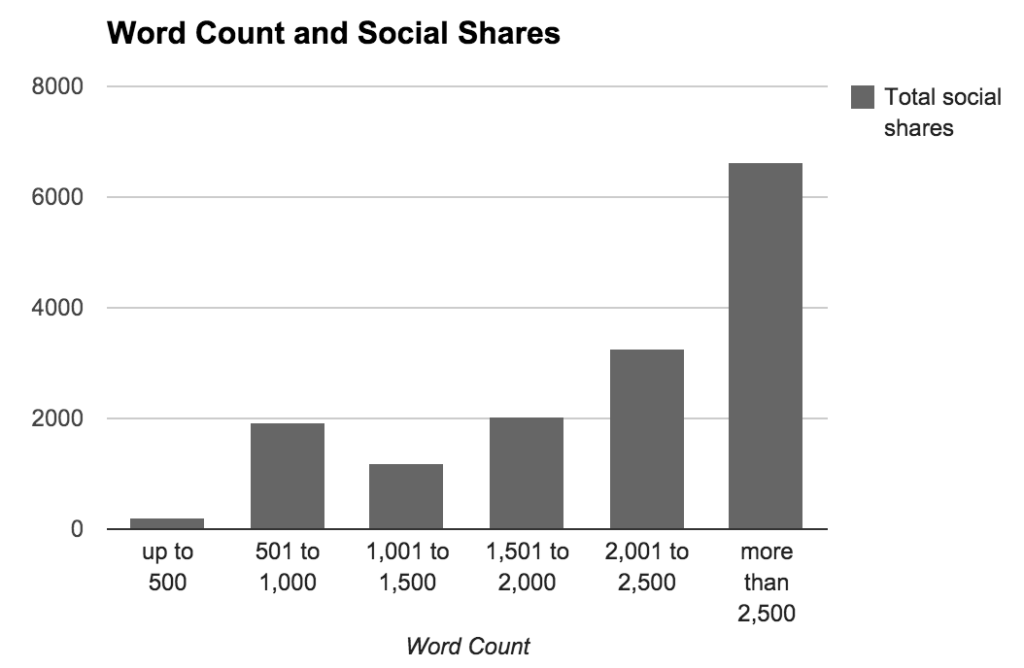
Our posts that exceed 2,500 words receive an average of 6,600 social shares—far and away the most popular post length on the blog.
Our next most popular post length—2,000 to 2,500 words—receive less than half that amount, 3,200 social shares.
2. Discover the posts that search engines love best, and optimize them
Pulling in the search statistics into the content audit reveals which ones might be bringing in the long-term traffic from Google. These posts would be great ones to hone in on and fully optimize.
To find these quickly, I added conditional formatting to the columns for search volume and for where we rank on the search results page. I added green backgrounds to any cell with more than 1,000 visits from search and a Top 5 page ranking.
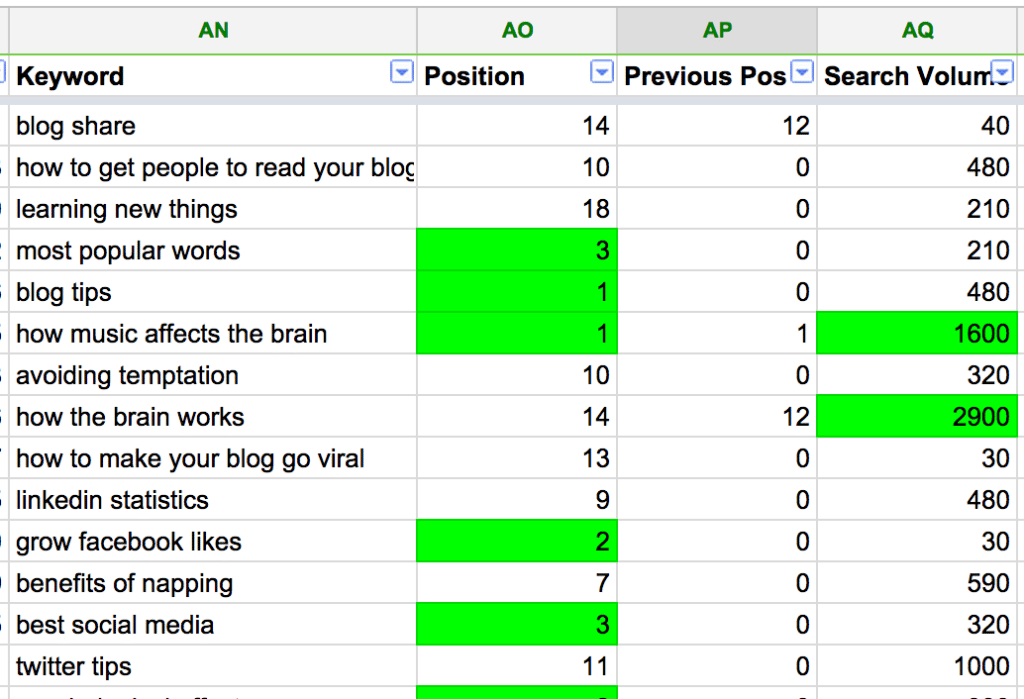
Armed with this knowledge, I can quickly see which posts might stand to have a good once-over. For instance, in the above example, I see that “how music affects the brain” gets 1,600 visits from search and that we rank No. 1 for the result. I could hop over to our blogpost and make sure everything is as well-optimized and shareable as possible.
This might include:
- Creating new, shareable images
- Update title tags and SEO information
- Adding email signup calls to action and Buffer signup calls to action to relevant spots in the article
- Proofreading
- Adjusting styles and headings to match our latest posts
Bonus: Optimize posts that get tons of traffic
You can also do this optimization on popular posts. Sort the content audit by unique visits and see which posts get the most traffic.
For these posts especially, it might be a good idea to add a quick call-to-action for an email signup or a product trial since these posts get viewed the most.
3. Learn from Pinterest success
One of the neat bits of data in this content audit is Pinterest pins. We’ve yet to optimize our blog posts for Pinterest, so it’s awesome to see that a few of them have really taken off on that channel.
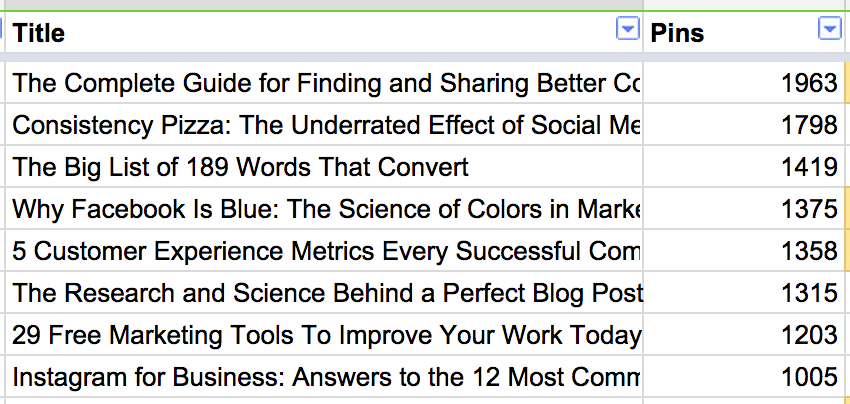
What do these posts have in common?
A quick glance at the top performers shows that each of these has a mini infographic element. Here’s an example of one from the Instagram Stats post:

In general, the images on these posts are a bit more vertical (a Pinterest specialty) than some of the other images we create for blogposts. It’s a good reminder to see what has worked well in the past and to incorporate that into our visual content strategy moving forward.
4. Find the best day of the week to publish new blogposts
Which publish days lead to the most social shares?
Which days lead to the most traffic?
We can grab this information from our content audit by using a pivot table.
For the Columns field, add the day of the week column. For the Values field, add total social shares and/or most traffic. Choose to summarize the Values field by average.
Here’s what we learn when we run the Buffer blog archives through these queries.
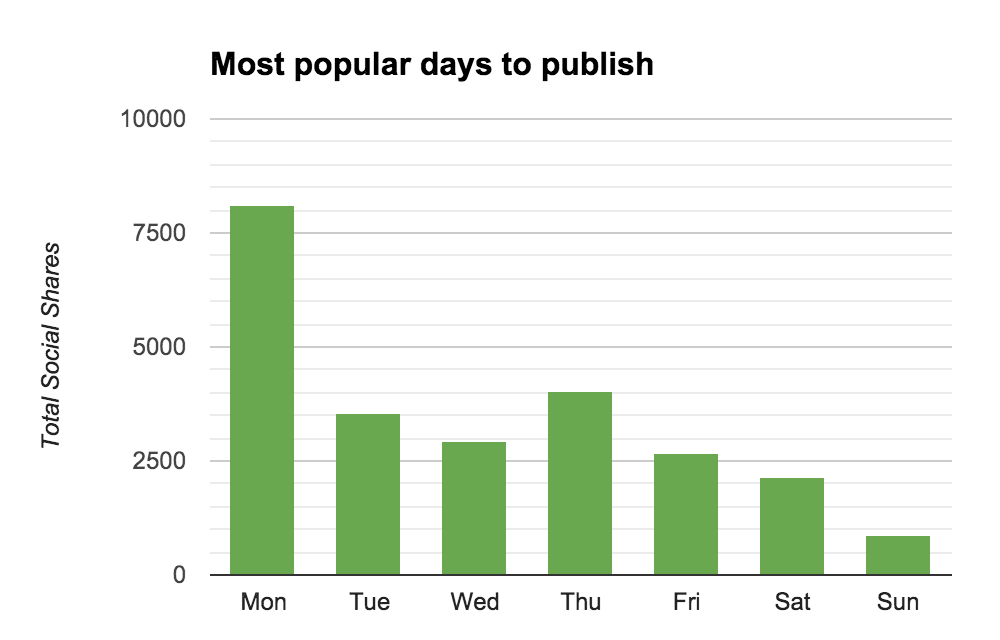
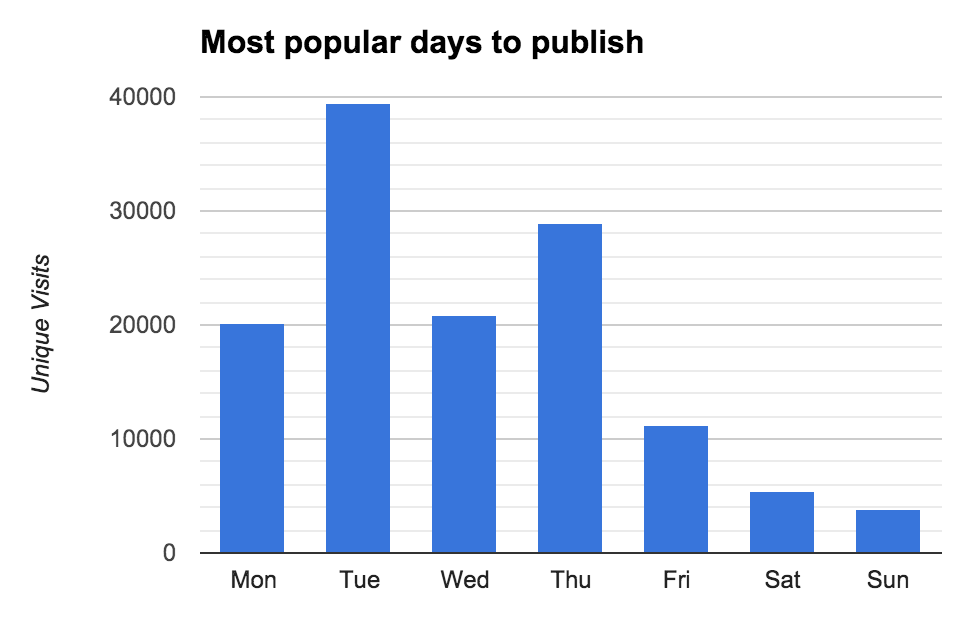
Monday is our biggest day for social shares.
Tuesday and Thursday are our biggest days for traffic.
Note: The data here measures shares and traffic all-time, not just the shares that happened and the visits that occurred on that particular day of the week.
5. Shorten the long page titles
The ideal length of a title tag is 55 characters, with a max of 70. If a page title runs too long, it risks being truncated in Google search results.

Our content audit tells the character count of the page title on each blogpost, so I can quickly see which pages might need an edit. We use the Yoast SEO WordPress plugin (one of our favorite plugins!), which allows us to set up custom page titles in our SEO settings.
For instance, this title:
8 Surprising New Instagram Statistics to Get the Most out of the Picture Social Network – – The Buffer Blog
… can be shorted to this …
8 Surprising New Instagram Statistics and Tips for Marketers

To make for an even quicker win, I can sort and filter the table in order to see the too-long title tags compared to the number of unique visits for the page. This’ll tell me which pages to address right away.
Tip: One of my favorite ways to do this is to apply conditional formatting to the title length column so that all values above 70 have a yellow background. Then I’ll sort the spreadsheet from most traffic to least traffic (“Z to A “sort), and I can easily browse the title length column to see which results stand out.
Takeaways
Running a content audit on your blog can reveal a huge number of insights into what’s sitting in your archives.
You can discover what’s worked in the past and what to try in the future.
You can see opportunities for quick wins and simple fixes that could have big effects.
I’m excited to try out even more analysis with the data we have from our Buffer blog audit. And I’d love to know what you find out if you run your blog through the same steps. Feel free to add to the discussion here in the comments with any questions, insights, or feedback!
Image sources: Blurgrounds, Icon Finder, Death to the Stock Photo
Try Buffer for free
140,000+ small businesses like yours use Buffer to build their brand on social media every month
Get started nowRelated Articles

Sending ads by mail may seem like a thing of the past, but this marketer thinks it’s a surprisingly effective approach for e-commerce brands.

Learn how to leverage AI social media content creation tools and save valuable time in your social media marketing efforts.

With the newsletters on this list, you'll be able to stay on top of all developments in social media and learn from amazing experts