


Facebook Insights is one of the most powerful Facebook marketing analytics tools available.
When you dive into your Facebook Insights, you’ll receive a wealth of data to help you understand more about your Facebook Page.
With so many different data-points available to measure — such as Likes, engagement, reach, and demographics — Insights will help you to understand how your content is resonating with your audience, how your Page is growing and provide you with an awesome overview of how your Facebook strategy is performing.
This complete guide will cover everything you need to know about the key sections of Facebook Insights and share tips to help you become proficient with Facebook analytics.
Plan, schedule, and analyze your posts to Facebook Pages and Groups with Buffer's Facebook scheduling and analytics tools.
Navigating this guide
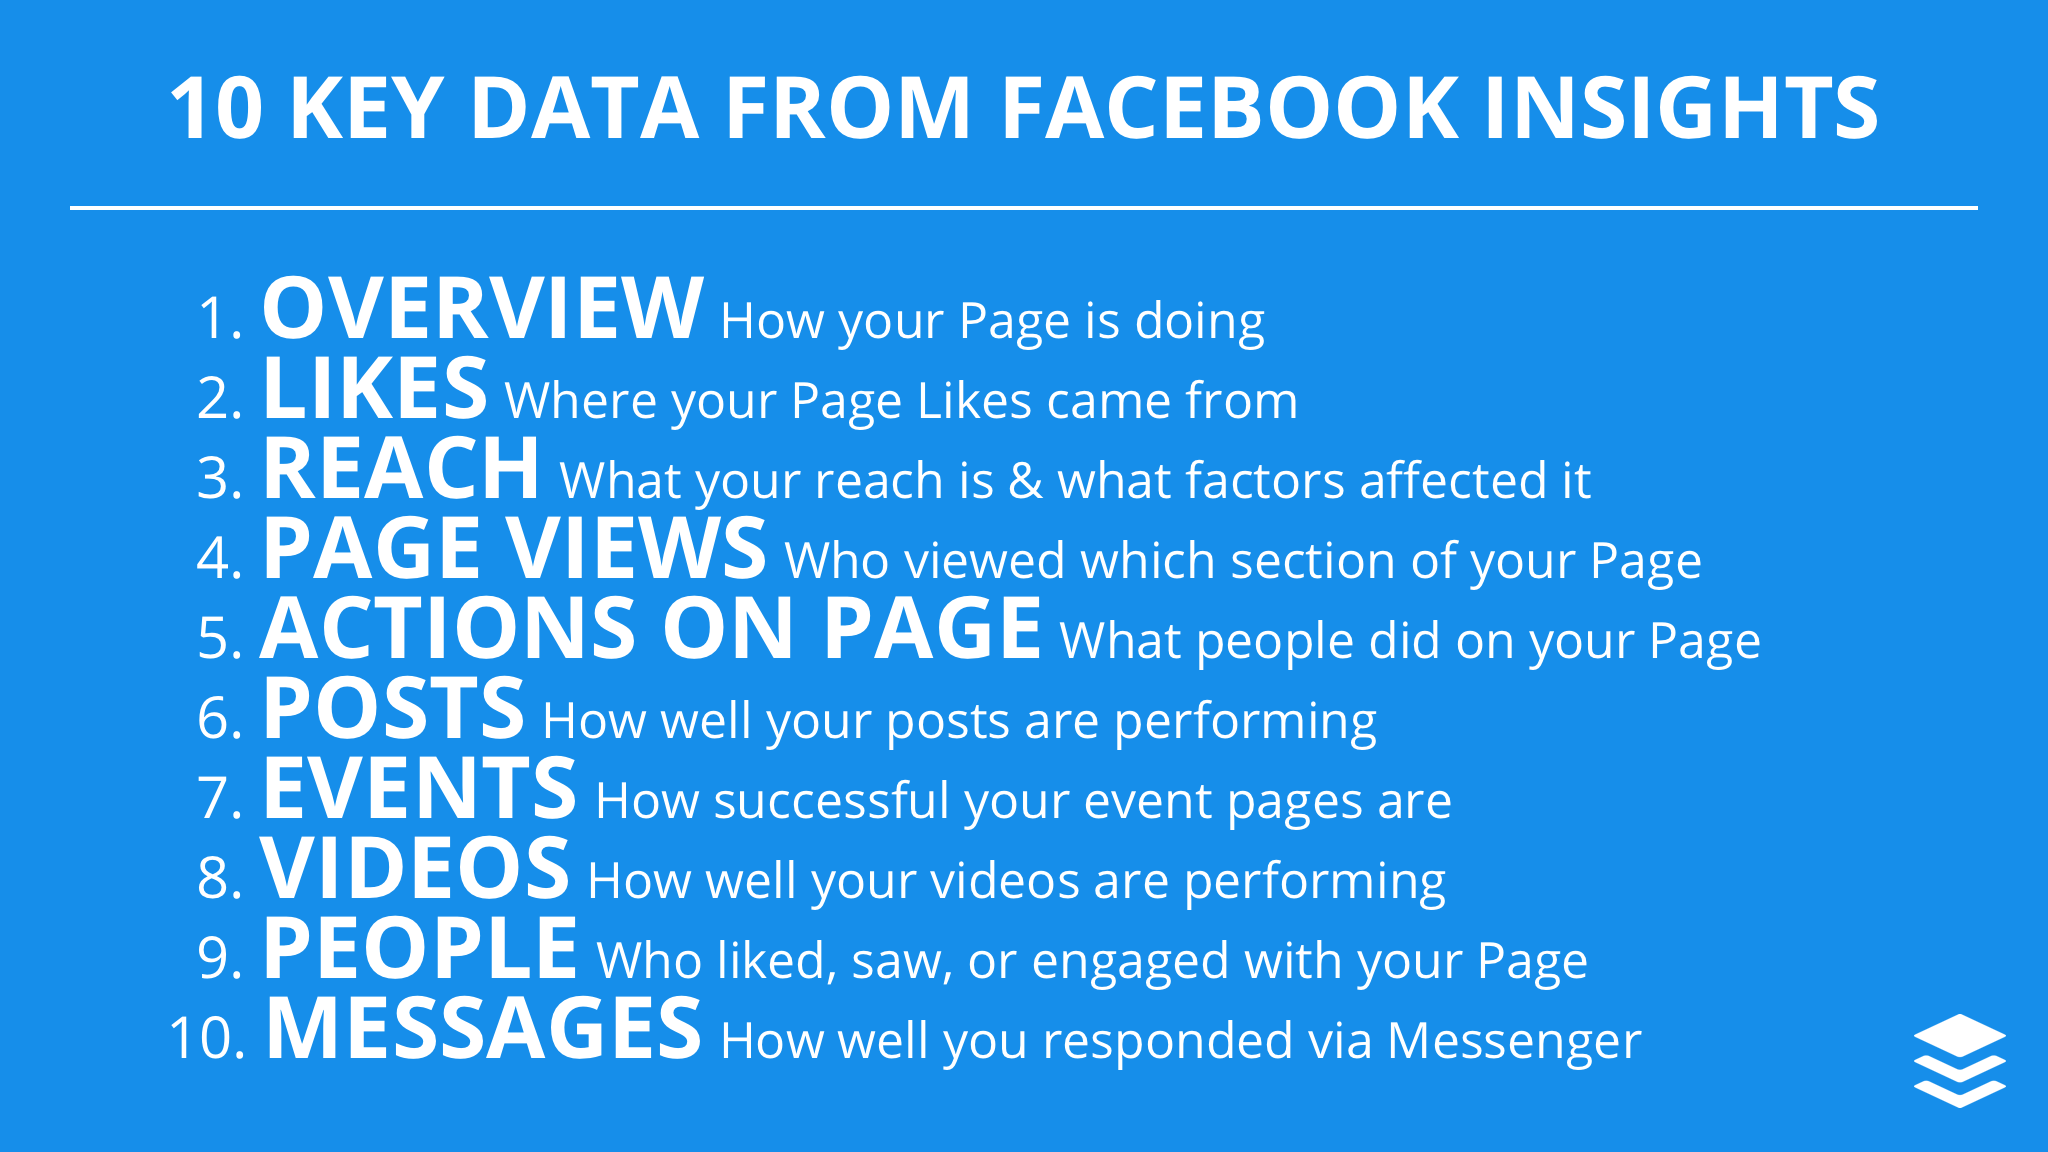
There’s a lot to learn about Facebook Insights. To make this guide easier to digest, I’ve broken the rest of this guide down into 11 bite-sized chapters — one for each of the 10 key tabs of Facebook Insights and a final chapter for the remaining tabs.
- Overview: How your Page is doing
- Likes: Where your Page Likes came from
- Reach: What’s your reach and what factors affect it
- Page Views: Who viewed which section of your Page
- Actions on Page: What people did on your Page
- Posts: How well your posts are performing
- Events: How successful your event pages are
- Videos: How well your videos are performing
- People: Who liked, saw, or engaged with your Page
- Messages: Response times and Messenger analytics
- Others (Promotions, Branded Content, and Local)
In each chapter, we’ll walk through the sections for each tab, explain how to use them, and share relevant tips for extracting more insights.
Let’s go!

Getting to Facebook Insights
To access Facebook Insights for your Facebook Page, head to your Facebook Page and click on “Insights”.

How to use Facebook Analytics
1. Overview:
How your Page is doing
The Overview tab within Facebook Insights does more than it says. Apart from showing you key metrics of your Page (Page Summary), it also shows you the key metrics for your five most recent posts and a brief comparison of your Page with similar Facebook Pages.
Sections:
- Page Summary
- Your 5 Most Recent Posts
- Pages to Watch
Page Summary

The Page Summary section shows you the key metrics of your Page for the last seven days, such as Page Likes, Post Engagement, and Reach. It also tells you the percentage change from the previous period and shows graphs for the period.
This section is great for getting a quick assessment of your Facebook Page performance.
For example, if you are focusing on growing your Page, you can quickly access your growth by looking at your Page Likes and Reach. If you are posting more videos to drive engagement, you can immediately see if your strategy is working by looking at your video views and post engagement.
Your 5 Most Recent Posts

This section shows you the key information of your latest five posts — published date and time, post caption, post type, targeting, reach, and engagement.
This section is great for getting a sense of how well your recent posts are performing and which type of posts are performing well recently. For example, you might notice that curated link posts outperformed other types of posts. Then, you could experiment with posting more link posts.
Pages to Watch

Pages to Watch is one of our favorite Facebook Page features. It gives you a quick comparison of your Page with a few other Pages you want to watch. If you click on any of the Pages, it’ll show you the top posts of that Page from the current week.
This section is great for seeing how your Facebook Page is performing among your peers and competitors. By looking at the top posts of those Pages, you can also stay in touch with what’s trending in your industry or curate great content for your Facebook fans.
Tips
Export your data (at Page Summary): If you want to analyze your Page data further, you can export metrics of your Page, posts, or videos as a CSV or Excel spreadsheet. Facebook provides a lot of data in the spreadsheet.

Click to see more insights (at Your 5 Most Recent Posts): Click on the post title to see the detailed breakdown of the performance of a post.

Discover what’s working (at Pages to Watch): If you click on any of the Pages, you will get a pop-up with the top posts of that Page — ranked from the most engaging to the least engaging.

2. Likes:
Where your Page Likes came from
The Likes tab lets you go beyond just knowing the number of Likes your Page has. It shows you the growth, averages, and sources of the Likes.
Sections:
- Total Page Likes as of Today
- Net Likes
- Where Your Page Likes Happened
Total Page Likes as of Today

This graph shows you the overall trend of your Page Likes. If the graph is showing a plateau or a downward trend, it’d be great to dig into it and understand the cause.
Net Likes

This graph informs you the daily growth of your Page Likes and breaks down the proportion of (organic or paid) Likes and Unlikes your Page receives. While it’s great to have positive net Likes, it’s helpful to monitor the Unlikes trend, too.
Where Your Page Likes Happened

This graph tells you where your Page Likes came from, such as directly from your Page, from your ads, or Page suggestions that Facebook serves to users. For example, if you are running Facebook Page Likes ads, you should see the “Ads” portion increasing.
Tips
Set your date range: At the top of the page, you can set the date range you are interested in. You can either drag the indicators on the graph, select “1W” (for 1 week), “1M” (for 1 month), or “1Q” (for 1 quarter), or set specified start and end dates.

Know your Like and Unlike sources: If you click or drag to select a date range on any of the graphs, it will show you the Like and Unlike Sources for that selected period.

Compare your averages: If you click on any of the metrics on the right of the graphs, you’ll get two averages for that metric — Your average for the last period and your average for the current period.

3. Reach:
What’s your reach and what factors affect it
The Reach tab informs you about the reach of your Facebook Page and posts and the factors that increase or decrease your reach.
Sections:
- Post Reach
- Reactions, Comments, and Shares
- Reactions
- Hide, Report as Spam, and Unlikes
- Total Reach
Post Reach

This graph shows you the number of people your posts have reached (organically or through promotions). It can be a quick way to assess your organic reach over time and if your ads are working.
Reactions, Comments, and Shares

When a post receives engagement, Facebook will serve it to more people as the engagement on the post implies that people are interested in the post. More engagement, higher reach.
Reactions

It seems like this chart will only appear if you have a high number of reactions to your Facebook posts. It’s a great way to judge the sentiments of your posts.
Hide, Report as Spam, and Unlikes

“Hide Posts”, “Hide All Posts”, “Report as Spam”, and “Unlike Page” are considered as negative feedback. They are ways users tell Facebook that they don’t want to see a Page’s posts. Facebook will accordingly show those posts to fewer people. As you’d want to keep these negative feedback low or zero, it’s great to monitor this graph.
Total Reach
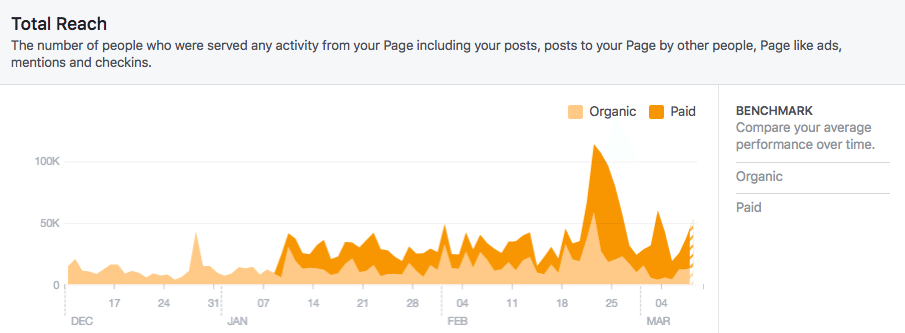
Total reach is the number of people who saw any activity from your Page such as your posts, posts to your Page, ads, mentions, and check-ins. Just like post reach, it’s a great way to see how your organic and paid reach has been growing. For example, the graph above is our total reach for the past quarter, and it’s showing a promising increase.
Tips
Set your date range and compare your averages: Just like in the Likes tab, you can set your data range at the top of the page and compare the averages of each metric by clicking on the metric.
Understand your posts activity: If you see a spike of reach, engagement, or negative feedback, you can click or drag to select that section of the graph and find out more. Facebook will show you the active posts during that period, in decreasing impression order.
For example, there was a spike in our reach on February 22. When I click on February 22 on the graph, I learned that this post was taking off that day and our audience likes such a post.

See your reach breakdown: If you prefer numbers over visualization, you can click or drag to select a date range on the Total Reach graph to see your total, organic, and paid reach in a table format.

4. Page Views:
Who viewed which section of your Page
The Page Views tab is a little like the traffic report in Google Analytics. In here, you’ll learn about your page views and top traffic sources.
Sections:
- Total Views
- Total People Who Viewed
- Top Sources
Total Views

Total views is the number of times people viewed your Page. If the same person visited your Page twice, it’ll be considered as two views.
Total People Who Viewed

Total people who viewed is the number of people who have viewed your Page. If the same person visited your Page twice, it’ll be considered only as one. This figure should be equal or less than your total views.
Top Sources

This graph shows the top five traffic sources that have directed people to your Page. Knowing this allows you to increase your efforts on those sources if you want to increase your page views.
Tips
Set your date range: Just like in the Likes tab, you can set your data range at the top of the page.
Breakdown the data: You can break the page views metrics down by certain characteristics. For total views, you can break it down by section (of your Facebook Page). For total people who viewed, you can break it down by section, age and gender, country, city, and device. This can help you understand more about the people who are interested in your Page.

5. Actions on Page:
What people did on your Page
The Actions on Page tab allows you to understand what people do when they are on your Page. The few actions that Facebook considered are clicking on “Get Directions”, clicking on your phone number, clicking on your website, and clicking on your action button.
Sections:
- Total Actions on Page
- People Who Clicked Action Button
- People Who Clicked Get Directions
- People Who Clicked Phone Number
- People Who Clicked Website
Total Actions on Page

This graph shows you the number of actions people have taken on your Page. If you are a local business, you might be more concern about the number of times people want to get directions to your place or get your phone number. If you are an online business, you might be more concern about the number of website clicks. (Action button is the huge blue button on your Page.)
People Who Clicked Action Button / Get Directions / Phone Number / Website

This graph and the subsequent graphs show you the number of people who took the respective actions on your Page.
Our action button says “Sign Up” and directs people who click on it to our homepage. From this graph, we can get a sense of the traffic our Page drove to our homepage. (We also use UTM for the link for additional tracking.)
Tips
Set your date range: Similar to the few tabs before, you can set your data range at the top of the page.
Breakdown the data: Just like your page views graphs, you can break the actions taken graphs down by certain characteristics.

6. Posts:
How well your posts are performing
The Posts tab contains all the information about your posts such as reach and engagement. You can also boost your posts from this tab directly.
Sections:
- When Your Fans Are Online / Post Types / Top Posts from Pages You Watch
- All Posts Published
When Your Fans Are Online

We believe that there isn’t a universal best time to post on Facebook, but there’s the best time for your brand to post on Facebook. This section can help you with that. It shows you how active your Facebook fans are, on average, on each day or the week and each hour of the day.
You can hover over each day to see an overlay of the activity on that particular day vs the averages.
Post Types

This section tells you how each type of posts (e.g. link, photo, or video) fare in terms of average reach and average engagement.
From here, you can tell which type of posts does best on your Page, and you can adjust your posting strategy accordingly. For example, if you find that videos have the highest average reach and engagement, you could experiment with posting more videos.
Top Posts from Pages You Watch

This section is quite similar to the Pages to Watch section in the Overview tab. While the one in the Overview tab shows you the overall performance of those Pages, this section shows you the top post of the week from each of those Pages and the engagement it received.
All Posts Published

This section lists all the posts you have published on your Page and the relevant information — published date and time, post caption, post type, targeting, reach, and engagement.
Tips
Sort your posts: You can sort your posts by published date, reach, or engagement (post clicks or reactions) by clicking on the title of the column.

View different metrics: You can view different metrics for reach and engagement. For reach, you can choose:
- Reach
- Reach: Organic / Paid
- Impressions: Organic / Paid
- Reach: Fans / Non-Fans
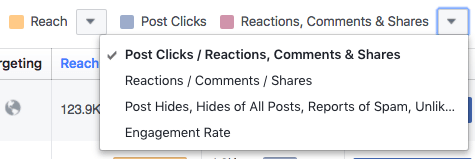
For engagement, you can choose:
- Post Clicks / Reactions, Comments & Shares
- Reactions / Comments / Shares
- Post Hides, Hides of All Posts, Reports of Spam, Unlikes
- Engagement Rates
7. Events:
How successful your event pages are
If you often organize Facebook events, the Events tab will enable you to be more data-driven by providing you with key data of your events. You can find out what’s working and what’s not working with your event promotion. You get data such as the number of people who saw your event, the number of people who responded to your event, and the demographics of your audience.
Sections:
- Events Stats (Awareness / Engagement / Tickets / Audience)
- Upcoming / Past
Events Stats (Awareness / Engagement / Tickets)

In this section, you have several graphs about the awareness and engagement of your all events. These are the data available:
Awareness:
- People Reached
- Event Page Views
Engagement:
- People Who Responded
- Event Actions
Tickets:
- Clicks on Buy Tickets
(For the data of specific events, see the tip below.)
Events Stats (Audience)

Apart from awareness and engagement, you can also get a breakdown of your audience by age group and gender. This can inform you about the type of people who are most interested in your events.
Upcoming / Past

The second half of the page shows you the insights of your upcoming and past events. You can toggle between upcoming and past using the drop-down menu in the upper-left corner.
Tips
Click to see more insights: If you click on an event title, a pop-up will appear, with the data of that particular event. As it shows data up to the last 28 days only, you might want to record them down after the event.

8. Videos:
How well your videos are performing
The Videos tab tells you how well videos are performing on your Page. It mainly tells you the number of video views, broken down into:
- Organic vs Paid
- Unique vs Repeat
- Auto-Played vs Clicked-to-Play
Sections:
- Video Views
- 10-Second Views
- Top Videos
Video Views

This graph shows you the number of times your videos were viewed. Facebook consider 3 seconds or more as a video view.
10-Second Views

This graph shows you the number of times your videos were viewed for 10 seconds or more. If your video is less than 10 seconds, Facebook counts a 10-second view when people watch 97 percent of it.
While this number tends to be lower than video views (i.e. the 3-second views), I think it is more indicative of the number of engaged views.
Top Videos

This section shows you the top five videos which have been viewed for three seconds or more, the most. It can give you a quick idea of the kind of videos that perform well among your fans.
Tips
View different breakdowns: In the upper-right corner of each graph, there is a drop-down menu where you can choose between different breakdowns.

Compare your averages: If you click on any of the metrics on the right of the graphs, you’ll get two averages for that metric — Your average for the last period and your average for the current period.
Click to see more insights: Clicking on a video title will bring up a pop-up with the deeper insights of that video. You can click on any of the stats and see even more insights.

9. People:
Who liked, saw, or engaged with your Page
The People tab is a simple overview of the people who liked your Page, saw your posts, or engaged with your Page or posts.
Sections:
- Your Fans
- People Reached / People Engaged
Your Fans

Your fans are people who liked your Page. This section breaks down your fans by age group, gender, location, and language. From here, you can tell which demographic are most interested in your Page.
People Reached / People Engaged

People reached are the people who saw your posts in the past 28 days while people engaged are the people who liked, commented on, or shared any of your posts or engaged with your Page (e.g. messaged) in the past 28 days.
What’s interesting is that people who saw or engaged with your posts are not necessarily only your fans. This creates the differences in percentages. For example, while 41 percent of our fans are women, 55 percent of people engaged are women. This could imply that our posts tend to be more interesting to women than men.
Tips
Learn more with Audience Insights: Audience Insights, a tool within Facebook Ads Manager, is much more powerful than the People tab for understanding your fans. While it does not show you information about people who saw or engaged with your posts, it shows much more information about your fans.
Besides demographics information, you can discover data such as other Pages that your fans like. (You can use this information to set your Pages to Watch!)
To access Audience Insights, head to Facebook Ads Manager and select “Audience Insights” from the drop-down menu in the upper-left corner. Alternatively, you can visit this direct link: https://www.facebook.com/ads/audience-insights/
Once there, select “People connected to your Page” and the Page you are interested in.

The U.S. is selected as the location by default. You can deselect it if you wish to look at your audience worldwide, however, Household and Purchase information are currently only available for the audience in the U.S.
10. Messages:
Response times and Messenger analytics
The Messages tab shows you the performance metrics of your conversations with people on Messenger.

Here’s what each of the metrics means:
Total conversations is the number of conversations between your Page and people on Messenger.
Your Responsiveness is the percentage of messages you’ve answered and your average response time.
Deleted Conversations is the number of conversations with your Page that people deleted.
Marked as Spam is the percentage and number of conversations from your Page that were marked as spam.
Blocked Conversations is the percentage and number of conversations from your Page that have been blocked.
Tips
See up to 180 days: For messages, you can see the stats for up to the past 180 days. You can select a timeframe by clicking on “Last 7 days”.

11. Others:
Promotions, Branded Content, and Local
The remaining tabs might not be as relevant to most people as those above or they might not even appear for you. I’ll briefly go through each of them in case you are curious about them.
Promotions

The Promotions tab gives you a quick overview of your recent promotions. It’s a great place for you to check your recent promotions while you are in your Facebook Insights. Alternatively, you can use the Facebook Ads Manager, which might be more comprehensive.
Branded Content

When you get mentions from a Verified Page (a Facebook Page with a blue tick), the Branded Content tab will appear among the list of tabs and the posts will show up there.
You’ll be able to see the reach and engagement stats, just like your own posts. You can even share and promote these posts.
Local
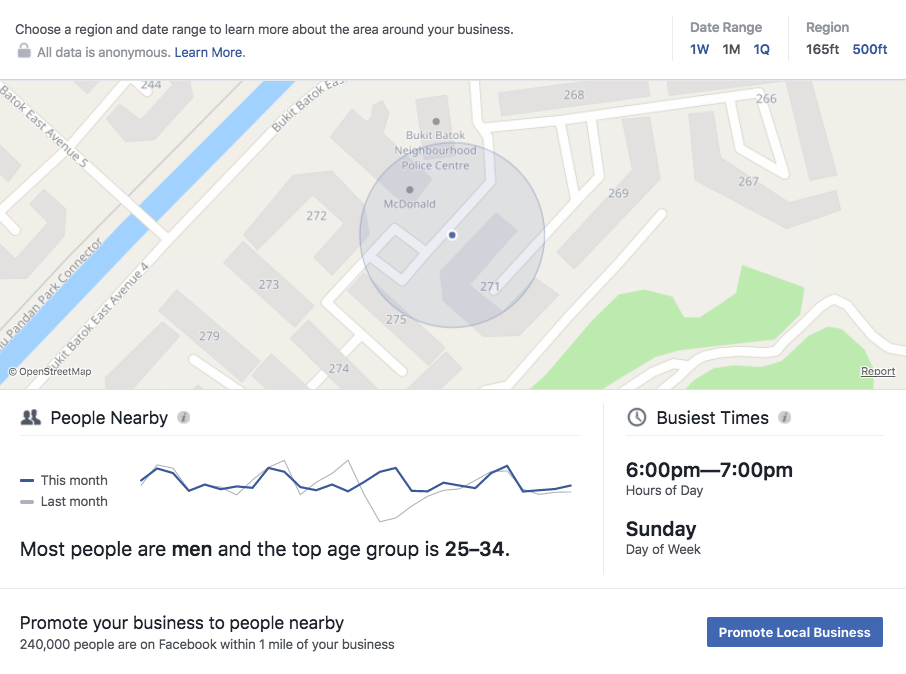
If you run a local business Page, you’ll have a Local tab. In this tab, you have information about the foot traffic in your area, demographic information about people near your place, and percentage of people nearby who saw your Facebook ads. (Mind-blowing!)
What’s your favorite part of Facebook Insights and analytics?
It’s so awesome that Facebook provides such a comprehensive analytics tool for free! From reach to posts, to events, to fans, Facebook Insights provide a wealth of data and analyses about your Facebook Page.
Is there a part of Facebook Insights that you love the most?
How do you use it for your business?
Do you use any other Facebook analytics tools?
I’d love to learn from you. Thanks!


