


Summary
In this guide, we’ll go through everything you need to know about Instagram analytics — from what metrics and insights are available to how to get all them for free to what you can do with them to boost your Instagram marketing.
You will learn
- The best free and paid Instagram analytics tools
- The types of metrics and data points you should be analyzing on Instagram
- How to take action and improve strategy based on your Instagram analytics
Over 1 billion people around the world use Instagram and spend an average of 28 minutes each day on the app. That’s a lot of people and plenty of time for brands to reach them.
But without Instagram analytics, your marketing efforts might be getting lost in all the noise.
In this comprehensive guide, we’ll explain the basics of Instagram metrics, share details on a few paid and free Instagram analytics tools, and provide tips on how to use analytics to improve your Instagram strategy.
Chapter 1: Instagram metrics: Understanding level-one versus level-two performance metrics
Instagram provides a wide range of metrics that help you measure your performance, understand your audience, and improve the results of your Instagram marketing.
Most metrics can be considered level-one metrics—or data in its most basic form. These Instagram metrics are straightforward numbers such as followers, impressions, reach, likes, comments, and clicks. While this information is helpful, the numbers are a snapshot in time. To focus on continuous improvement, growth, and optimization, you’ll need to look at level-two performance metrics.
Calculating level-two performance metrics with Instagram analytics
Metrics without context won’t help you take action.
If you’re comparing your follower count to a celebrity influencer’s, your account will likely seem unimpressive—and that comparison won’t help you improve your own content. Calculating level-two performance metrics is all about using your own data as the benchmark so you can pinpoint what your audience loves (and what they scroll right by).
There are three general types of level-two performance metrics:
1. Growth
Growth metrics show you the change (increase or decrease) of a metric. For example, follower growth shows how your follower count changes over time.
(Metric at Time 1 - Metric at Time 2 / Metric at Time 2) x 100 = Growth %
For example, if you ended October (Time 1) with 950 followers and had 710 followers in September (Time 2), your follower growth rate would be 33.8%.
Other Instagram metrics to track for growth: impressions, reach, engagement, clicks, and replies.
2. Rate
Rate metrics give you a percentage figure to help you understand a particular metric relative to another metric. For example, interaction rate is the percentage of your followers that have interacted with your post, story, or IGTV.
For posts and IGTV, Instagram analytics groups likes, comments, saves, and shares under interactions. For Instagram stories, replies and shares are considered interactions.
(Metric (e.g., number of interactions on a post) / Follower count when the post was published) x 100 = Rate %
If you have 950 followers and a post received 175 interactions, that post’s interaction rate is 18.4%.
For Instagram Stories, completion rate is a useful metric if you want to see what percentage of people watched the entire story.
(Number of impressions on final post / Number of impressions on first post ) x 100 = Instagram Story completion rate %
So, if 93 people viewed the first post and 59 made it to the end, your Story’s completion rate would be 63%.
3. Average
Average metrics give you a benchmark for the general performance of your Instagram posts. For example, the metric “average likes per post” tells you generally the number of likes each of your posts received.
Sum of metric for a period (e.g., total likes on posts in January) / Number of posts in that time period = Average
If you shared 12 posts in January and received a total of 715 likes, your average likes per post would be 59.
The common denominator to use is the number of posts (i.e., per post). But you can also use a time period (i.e., per day or per month). For instance, you could calculate the average number of viewers for your Instagram Live videos on different days of the week to determine which day might be best to live stream on Instagram.
Not interested in doing the math? Many of the Instagram analytics tools covered in Chapters 3 and 4 automatically calculate these metrics for you.
Chapter 2: How to view Instagram analytics with Instagram Insights
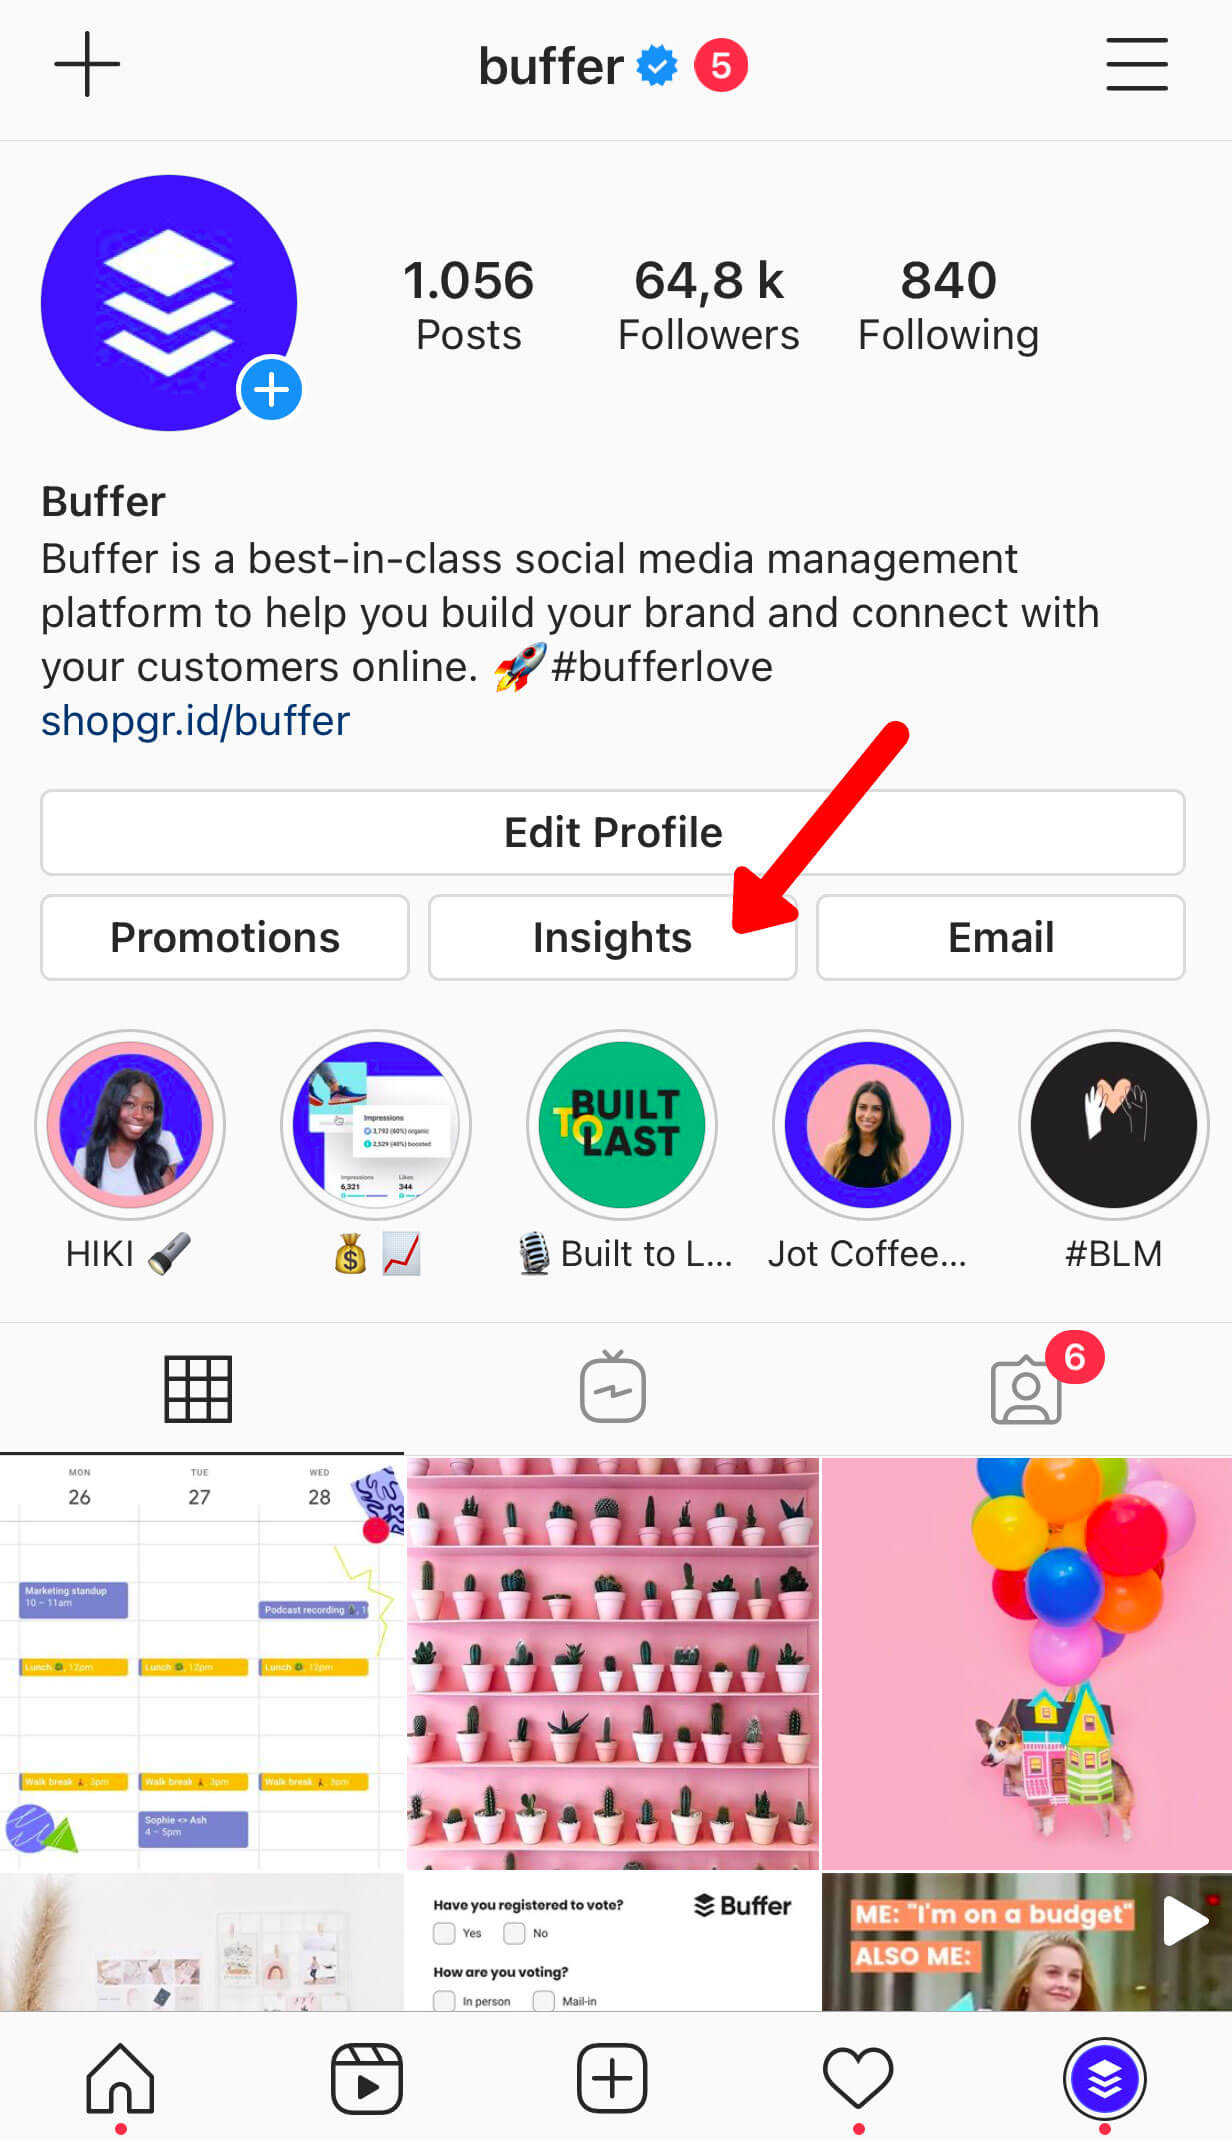
To gain access to Instagram Insights for your Instagram account, you’ll have to convert your personal Instagram profile to a business account. Here are the simple steps from Facebook.
Once you’ve converted to a business account, you’ll see an “Insights” button on your profile.
f you’re looking for Instagram Insights for desktop, unfortunately, you won’t find it. For now, Instagram Insights is only available on mobile. If you want to run reports on a computer, take a look at the free and paid Instagram analytics tools we discuss later in this article.
Instagram Insights sections
After you tap the “Insights” button in your business account, you’ll see data for the last seven days broken into the following sections.
Overview
- Accounts reached
- Content interactions
- Total followers
Content you shared
- Instagram Stories
- Photos
- IGTV
- Promotions
You can click on any of these sections to dig deeper into specific posts. You’ll find information such as what content led to profile visits and follows, which days your content received the most interactions, and other Instagram audience details.
Chapter 3: Free Instagram analytics tools for detailed metric tracking
Instagram Insights is a great start, but there are several free Instagram analytics tools that allow you to explore important metrics even further.
Here’s a quick walkthrough of our top 3:
1. Keyhole
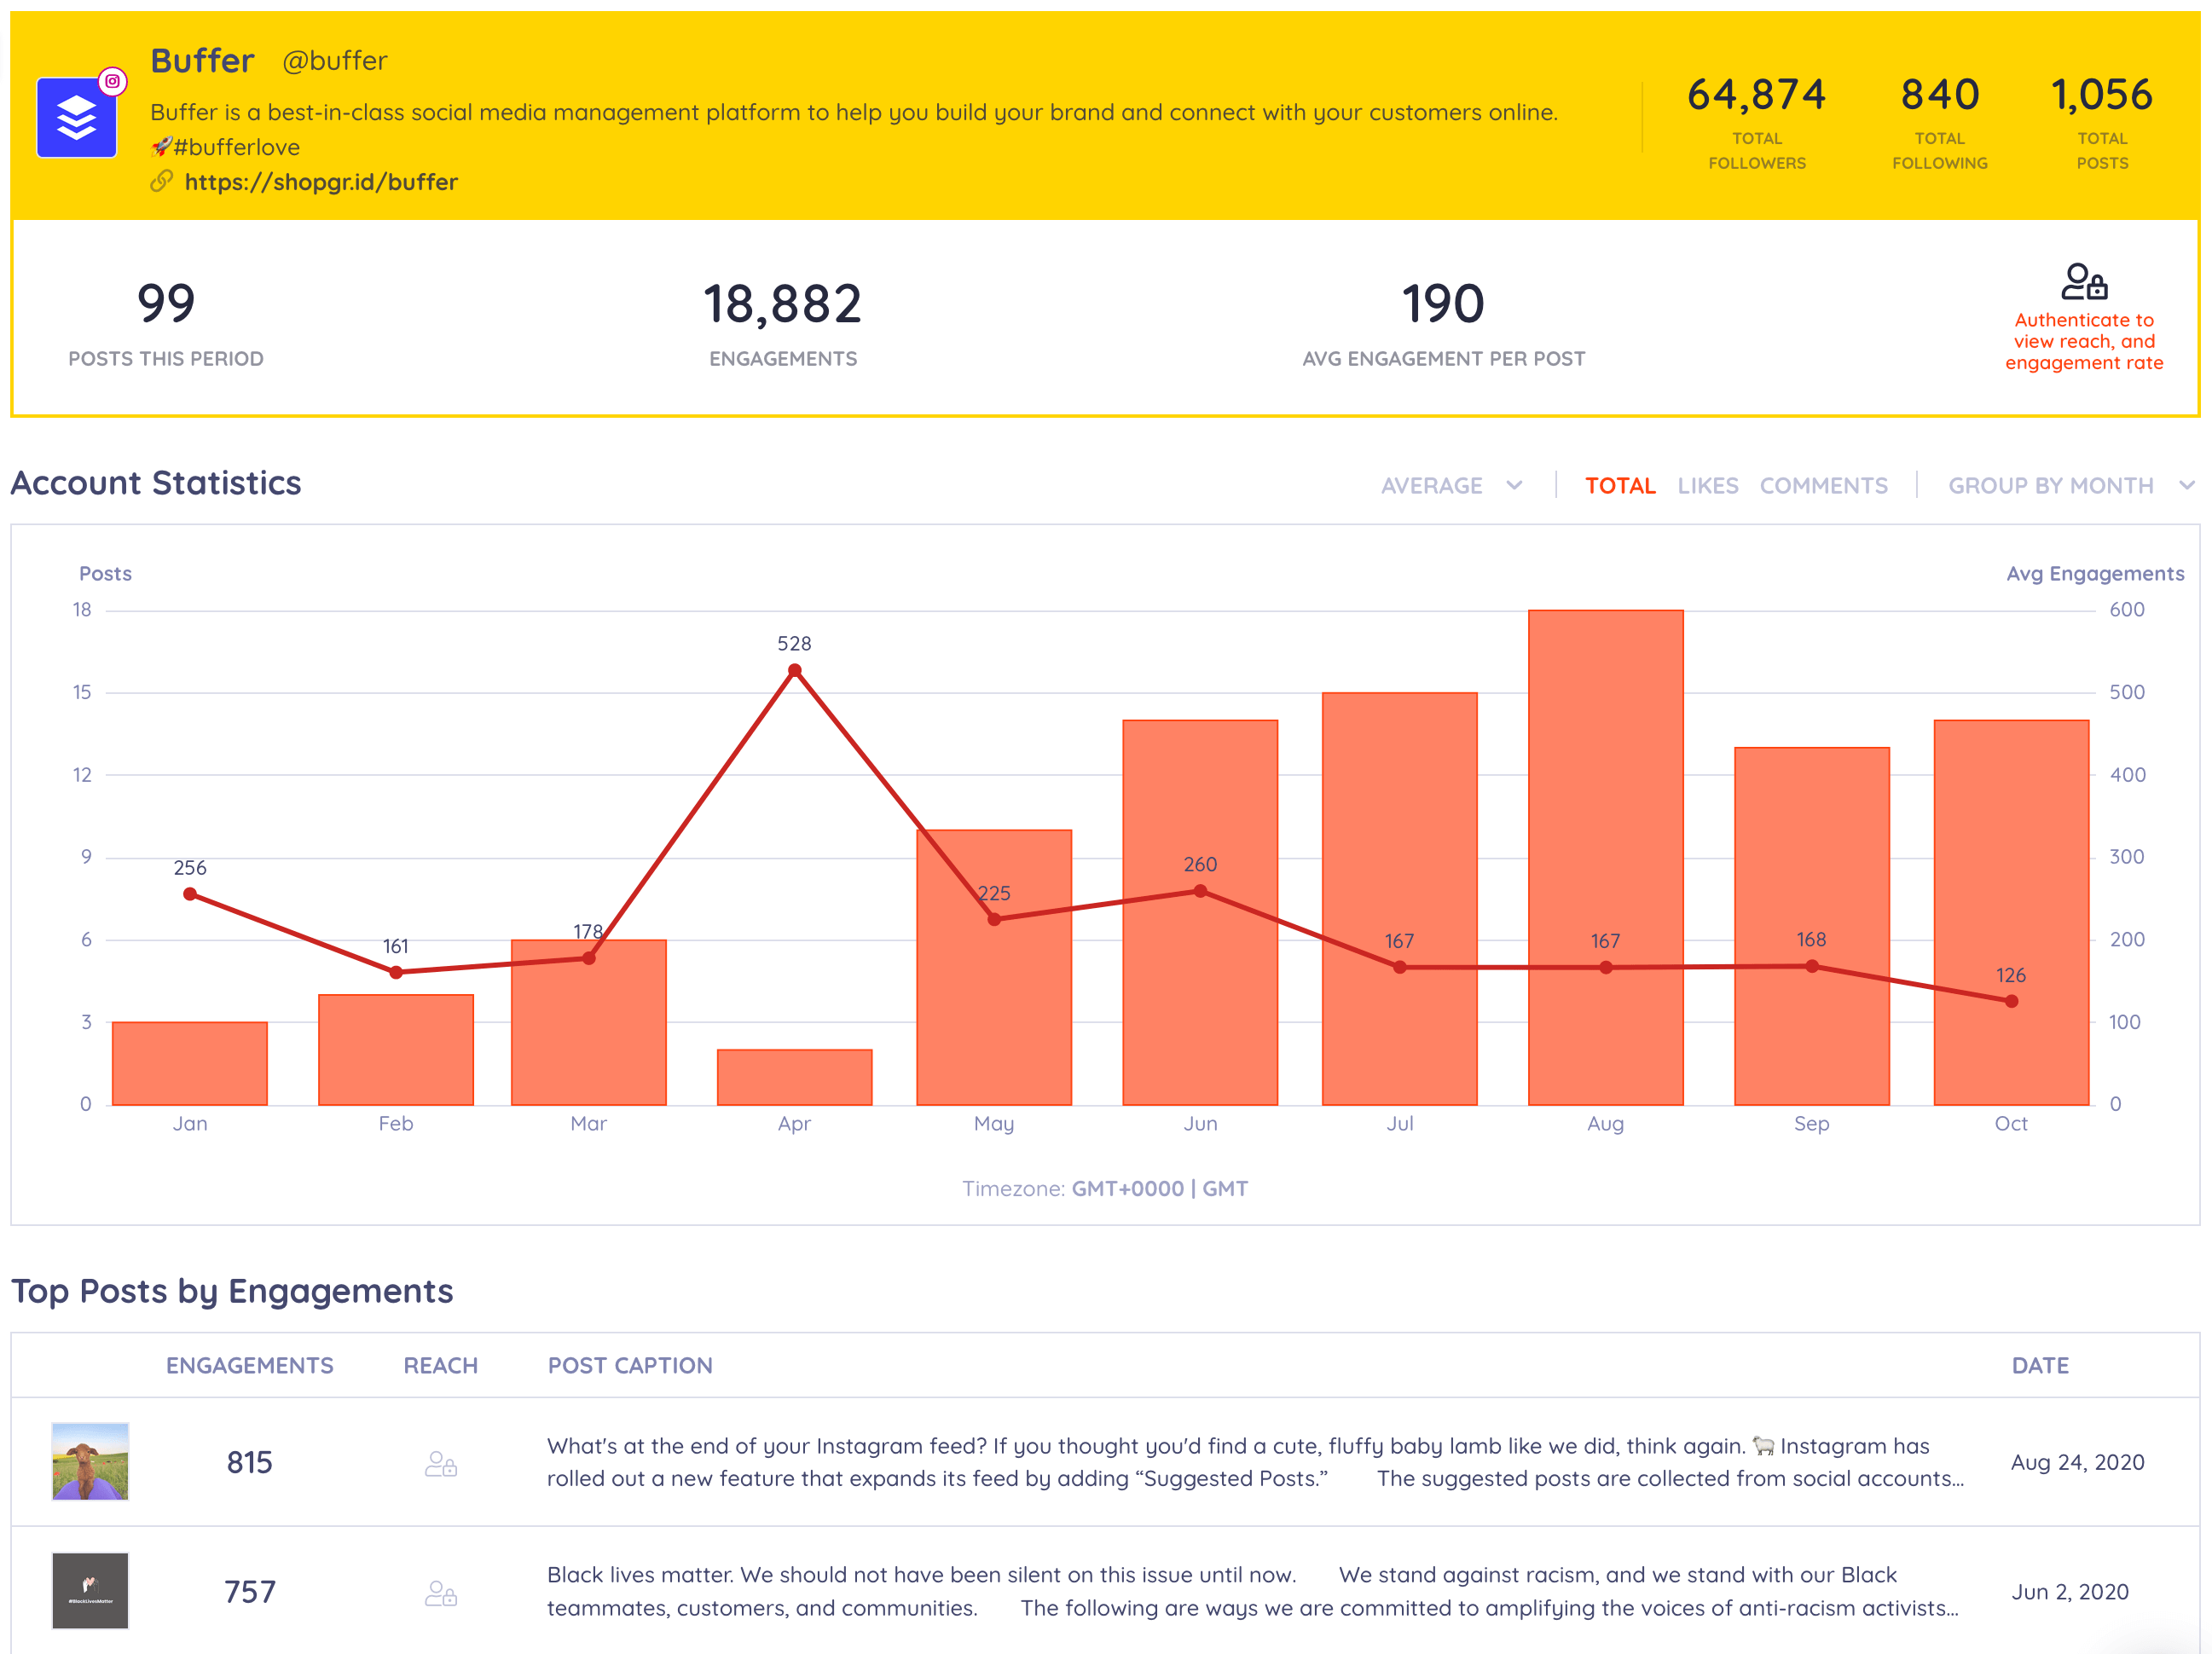
The preview will show data for up to one year with a max of 99 posts, which is great for a free tool! You can even authenticate your account to gain access to deeper insights, including engagement rate and reach.
Keyhole key data available
Account tracking
- Number of posts per week (shown as a graph)
- Engagements per week (shown as a graph)
- Top posts by engagements
- Top hashtags by engagements
Optimization
- Optimal post time
- Optimal post length
- Top hashtags by engagement
2. Socialbakers
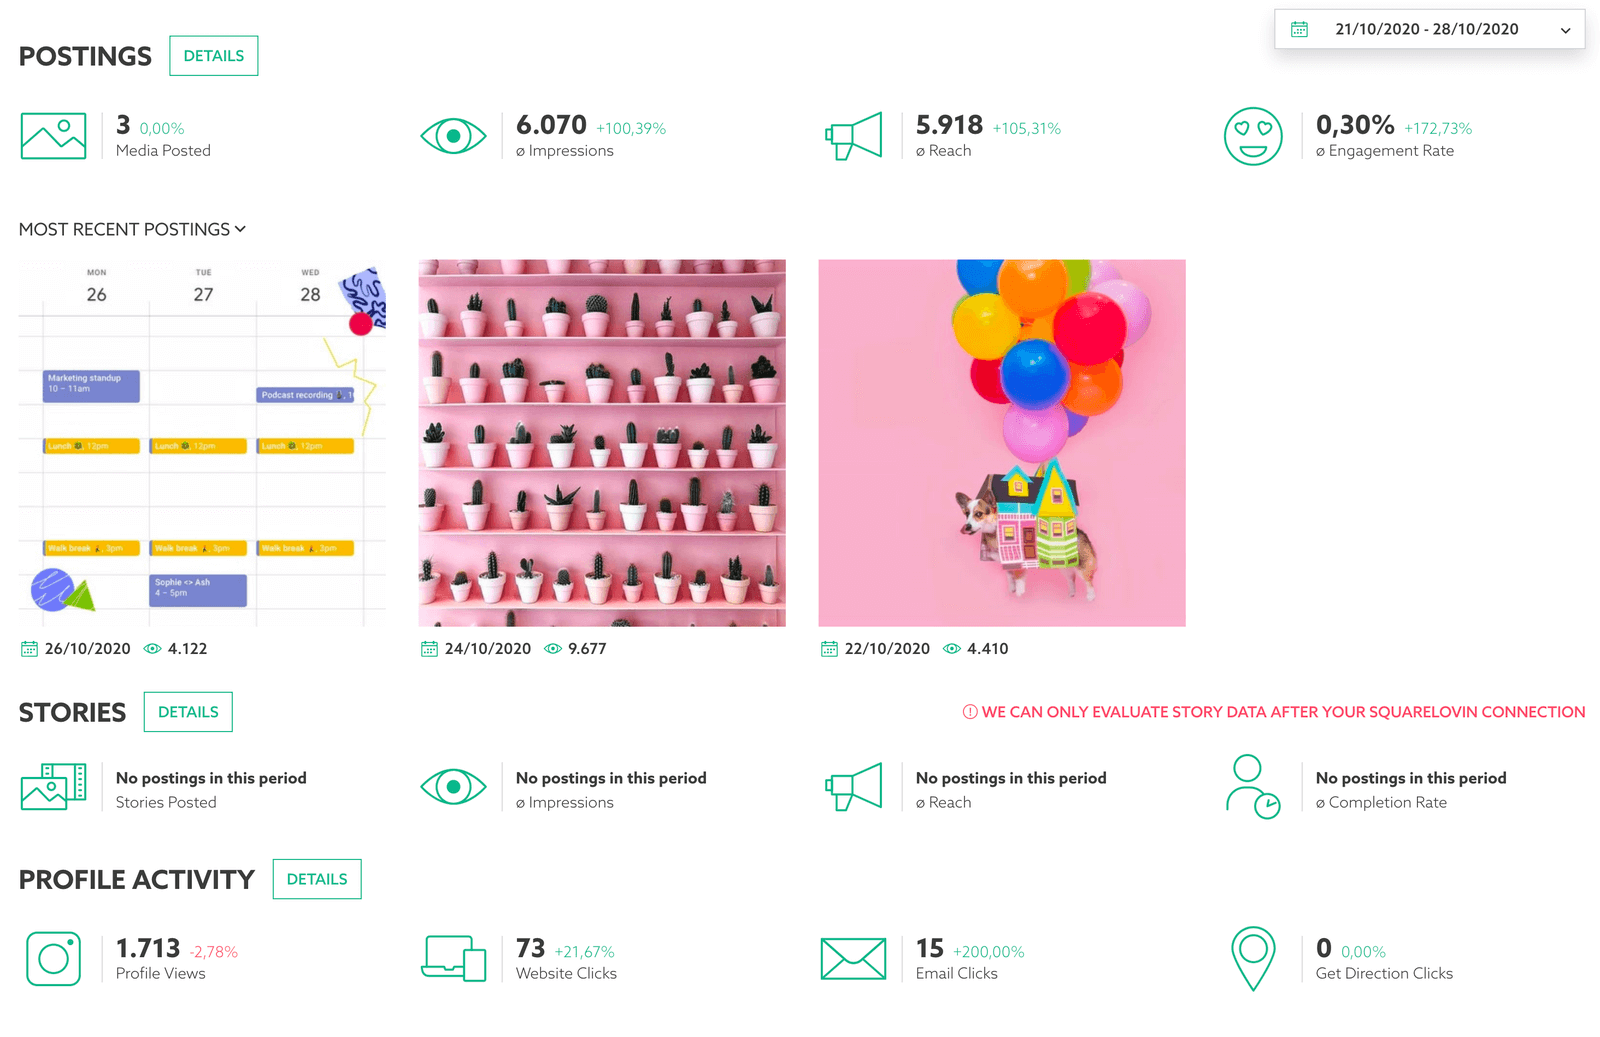
Socialbakers is a social media analytics tool that provides a simple Instagram stats tracker. It offers much of the basic information that might interest you in a visually appealing site. Note: Socialbakers requires a work email, so you’ll need an email with a business domain.
Socialbakers key data available
- Top Stories broken down by metrics such as impressions, completion rate, reach, etc.
- Most-liked posts
- Most-commented posts
- Top hashtags used
- Follower growth over time
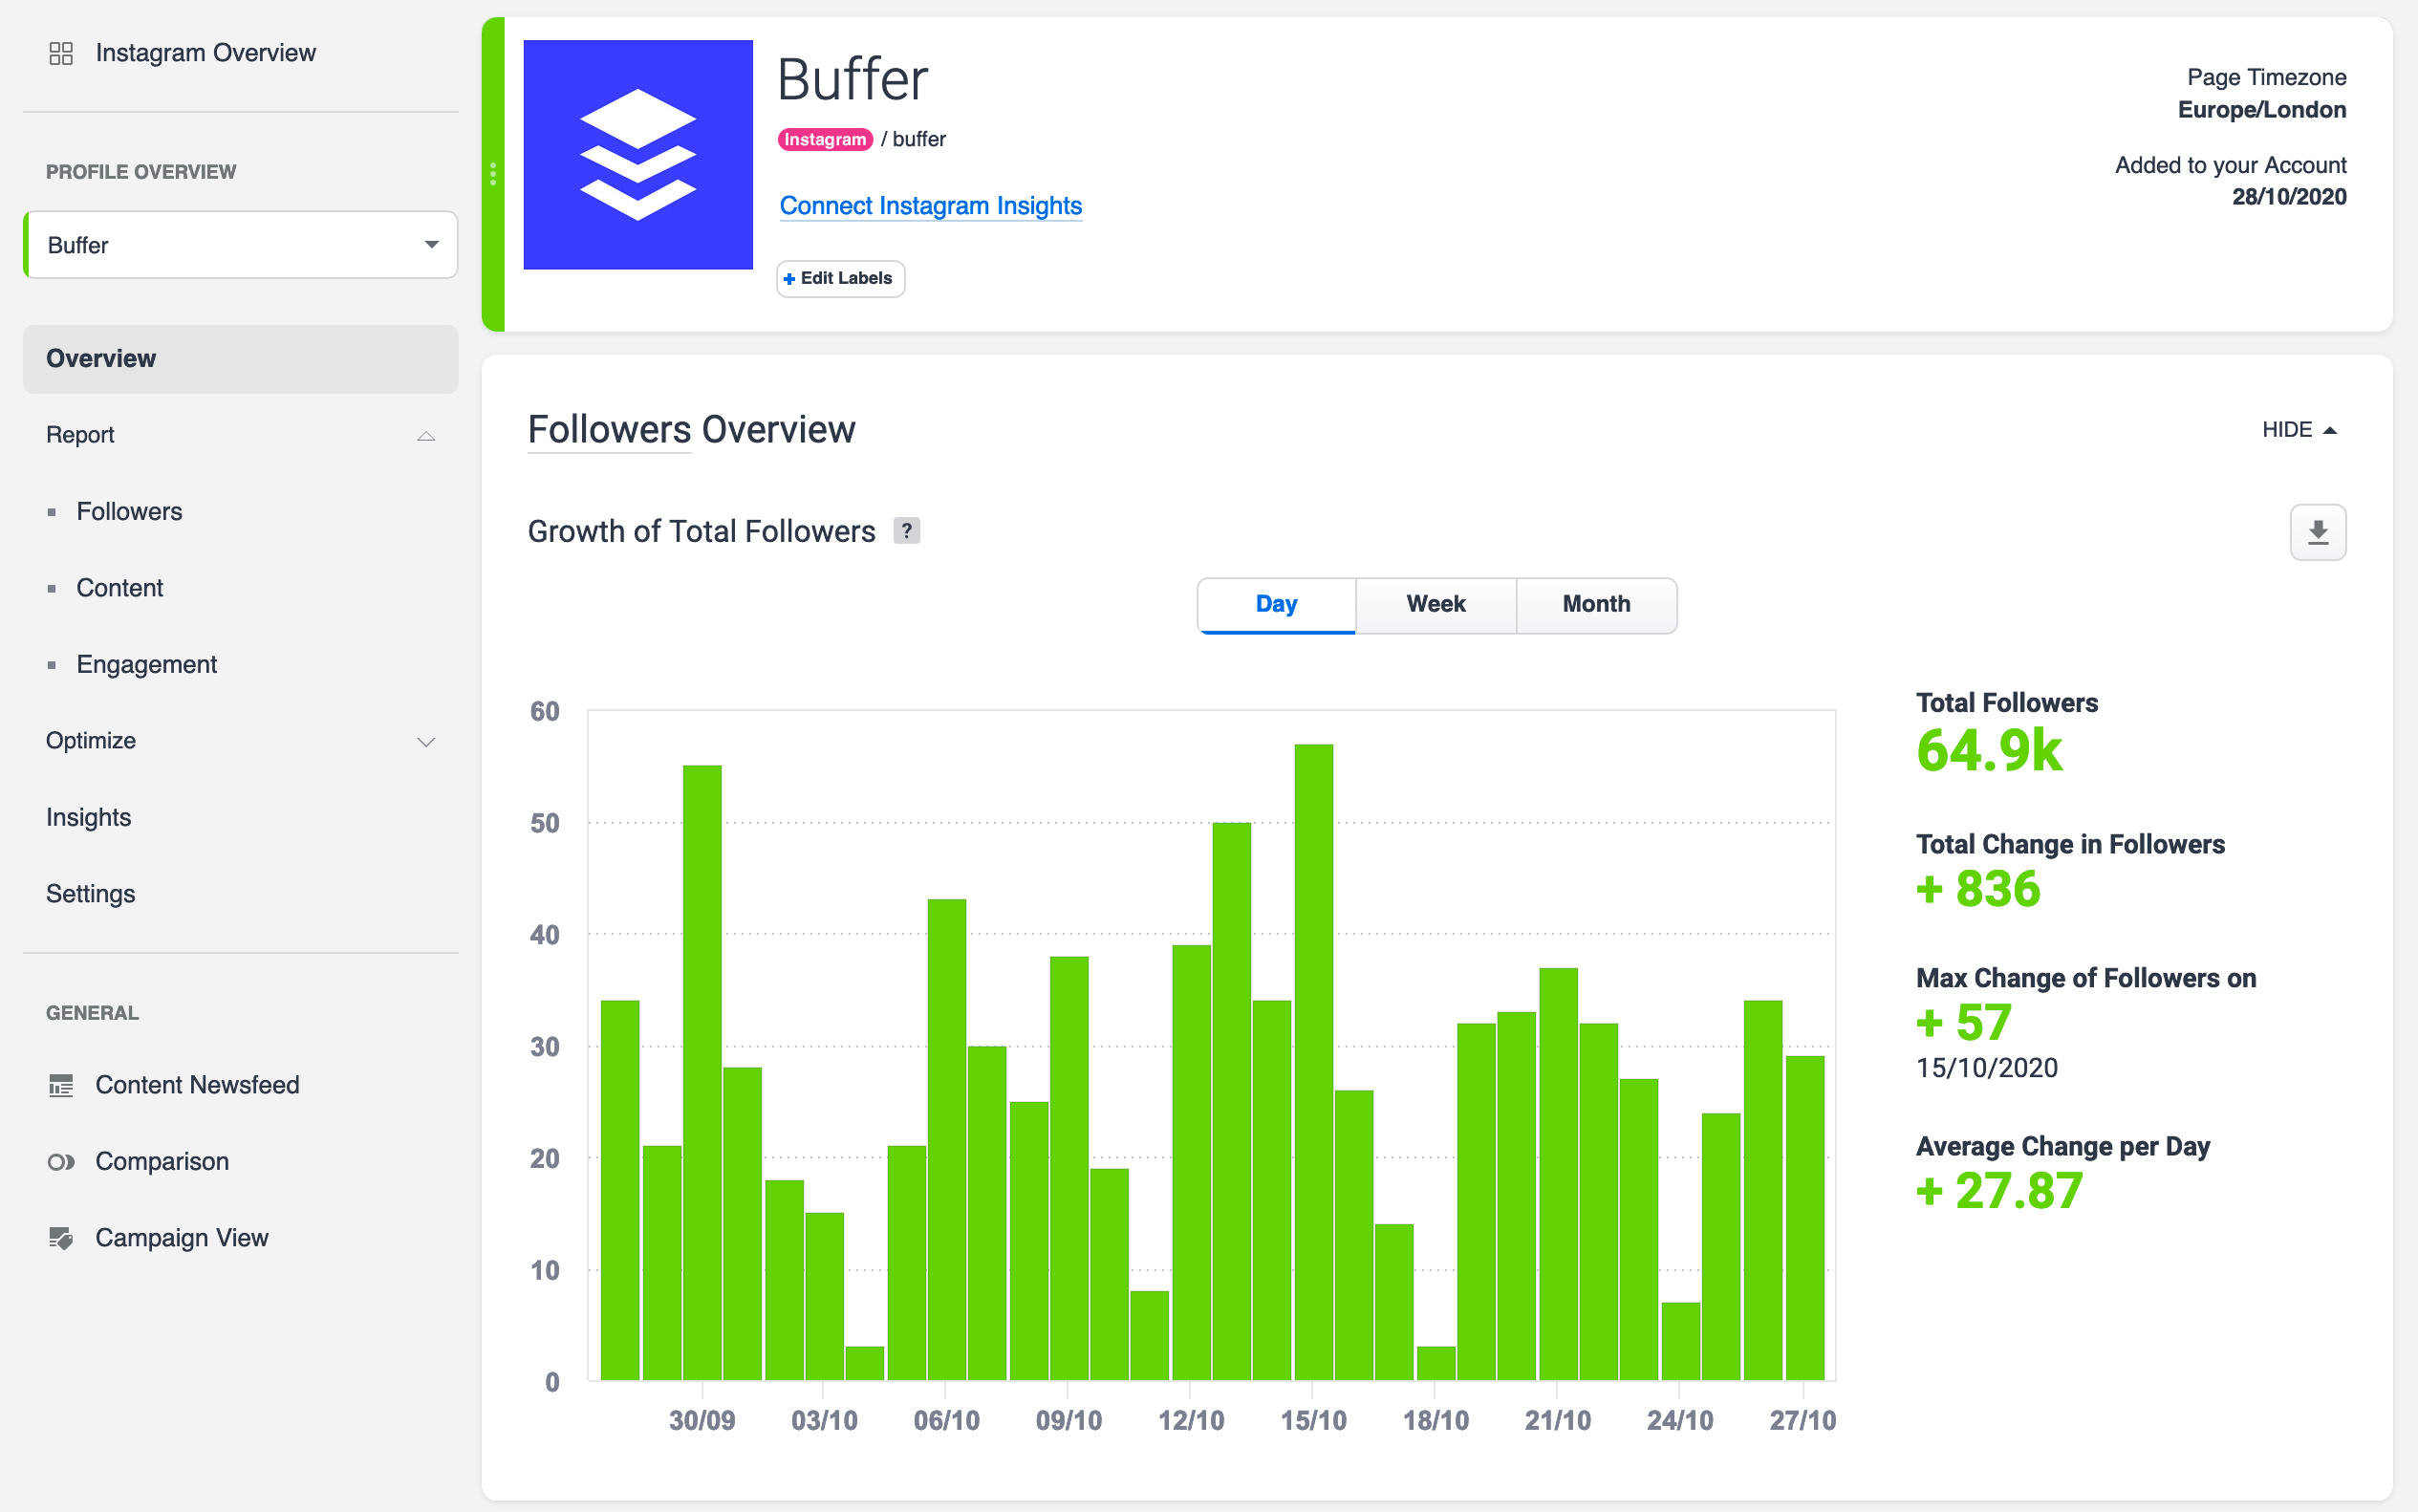
3. Squarelovin
Squarelovin is a user-generated content platform for Instagram, and it has a free Instagram analytics tool. You can connect more than one Instagram account to the tool and manage them using one dashboard.
Squarelovin key data available
- Overview (follower growth, latest posts, etc.)
- Monthly analytics (likes, comments, most-liked posts, and most-commented posts)
- Engagement (likes and comments received shown in graphs, most-liked media, and most-commented media)
- Optimization (best time to post and user interactions shown in graphs)
Chapter 4: Paid Instagram analytics tools to upgrade your strategy
If you have the budget to spend a bit on an Instagram analytics tool, here’s a list of the paid, specialized tools, which have several more powerful features.
1. Buffer Analytics
Prices for Buffer's analytics start at $35 per month with a 14-day free trial.
Obviously, we’re biased, but the analytics available within Buffer can really help you level up your Instagram marketing. Custom reports and centralized performance tracking allow you to keep an eye on all of your social media platforms, not just Instagram.
With custom reports, you can decide which metrics matter most to you, design your own reports, and let the data roll in daily. Once you set up a report, Buffer Analyze will update automatically and let you view progress over your desired time period. For example, this custom report looks at performance for one month.
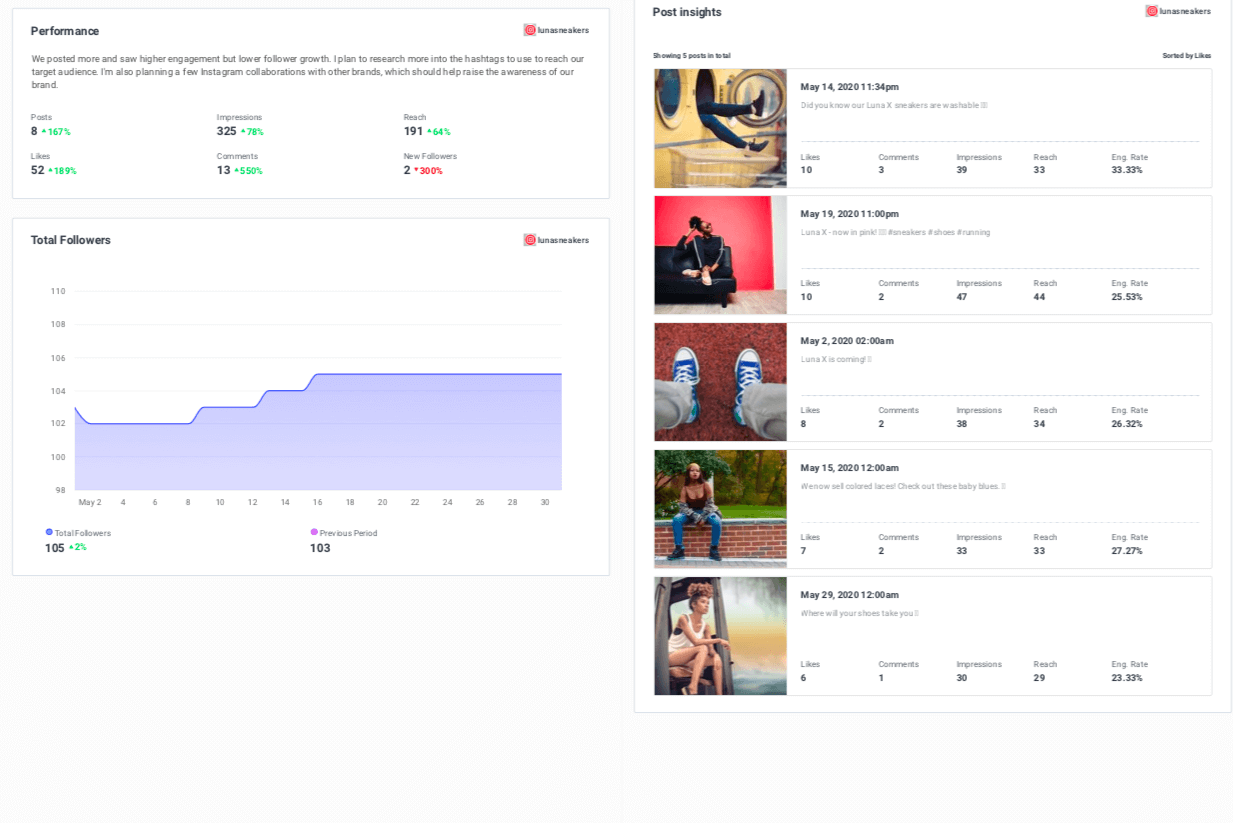
Buffer's analytics help you determine your best times to post, the best types of posts, and even how often you should post to maximize reach and engagement. The tool studies your data over time so it can continue to make informed recommendations as well as predict how your followers will respond to your content.
If you’re looking for other options, here are some additional paid Instagram analytics tools to consider.
2. Iconosquare
Iconsquare prices start from $29 per month with a 14-day free trial.
Iconosquare focuses on tracking your audience’s engagement habits so you can narrow in on what your audience likes to see. Plus, the Instagram analytics graphs give you a better idea of when your Instagram Stories and posts are most likely to reach your followers.
3. Minter.io
Minter.io prices start at $9 per month with a 14-day free trial.
Minter.io tracks the standard Instagram metrics but is best known for hashtag marketing campaign insights. Hashtag reports show how many posts use a specific hashtag, the type of post, and the average number of likes and comments those posts receive.
4. InfluencerDB
InfluencerDB offers custom pricing packages.
As the name implies, this tool focuses on managing influencers. InfluencerDB helps you build up an influencer community, manage influencer campaigns, and gather data about your influencer team.
5. Dash Hudson Instagram Insights
Dash Hudson Instagram Insights offers customer pricing packages.
This paid Instagram analytics tool automatically delivers weekly and monthly reports straight to your inbox. You can tailor your reports and recommendations to different goals, such as increasing engagement or maximizing influence ROI.
Chapter 5: How to act on your Instagram analytics
Once you gather all your Instagram metrics and discover audience insights, you’re ready to improve your marketing. Here are several ideas on how to use Instagram analytics to achieve better results.
Change your posting day and/or time
There isn’t a single best time to post on Instagram. Instead, each brand has its own perfect time to post. With Instagram analytics, you can find your ideal posting time based on your audience’s habits and past content’s performance.
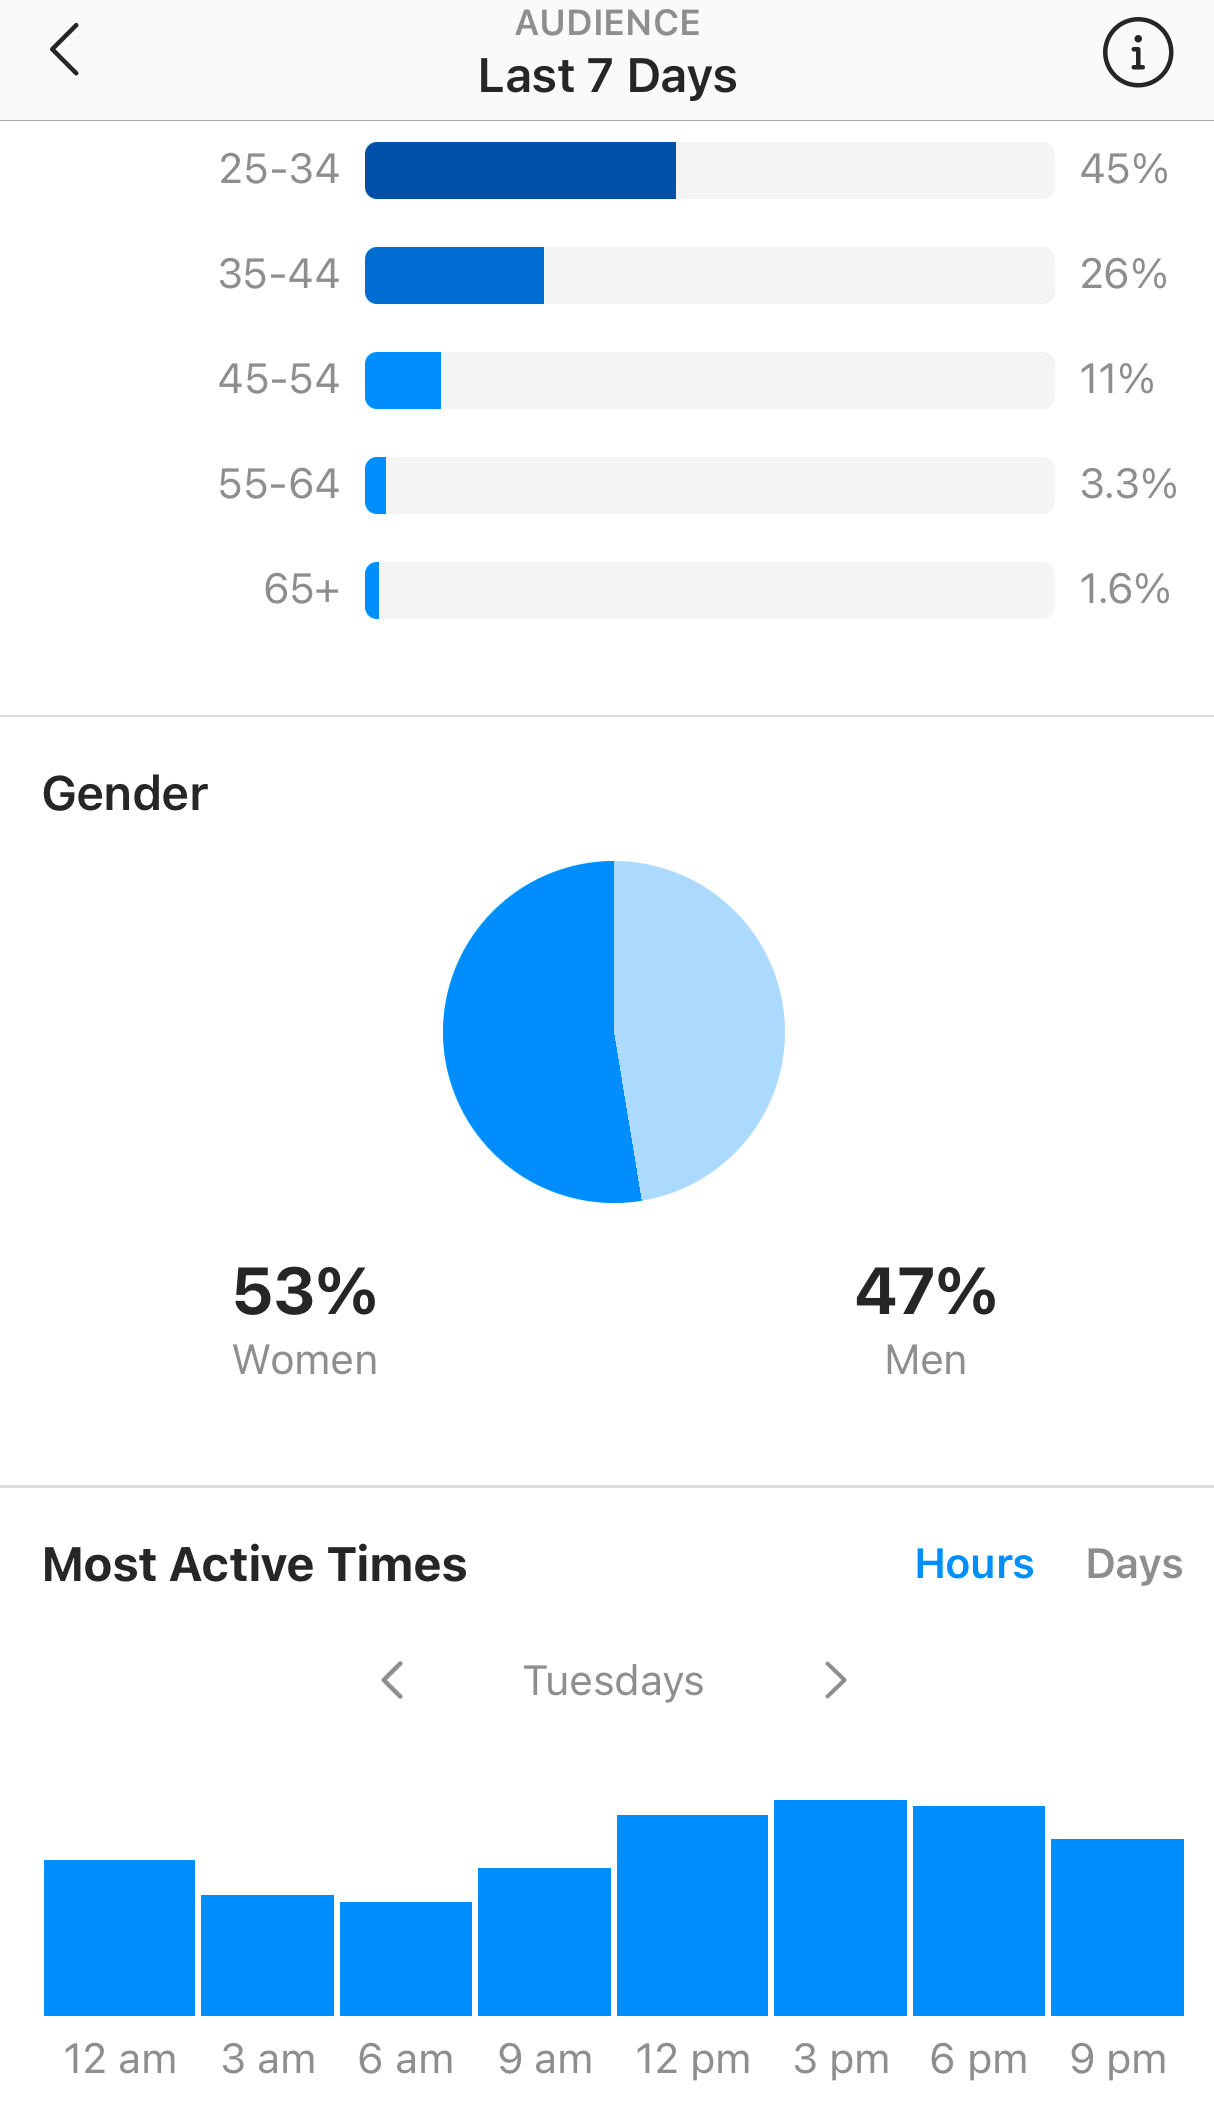
With Instagram Insights from the Instagram app, you can tell the days when your followers are most active and the average times they’re on Instagram on a typical day.
Adjust content based on performance and Instagram demographics
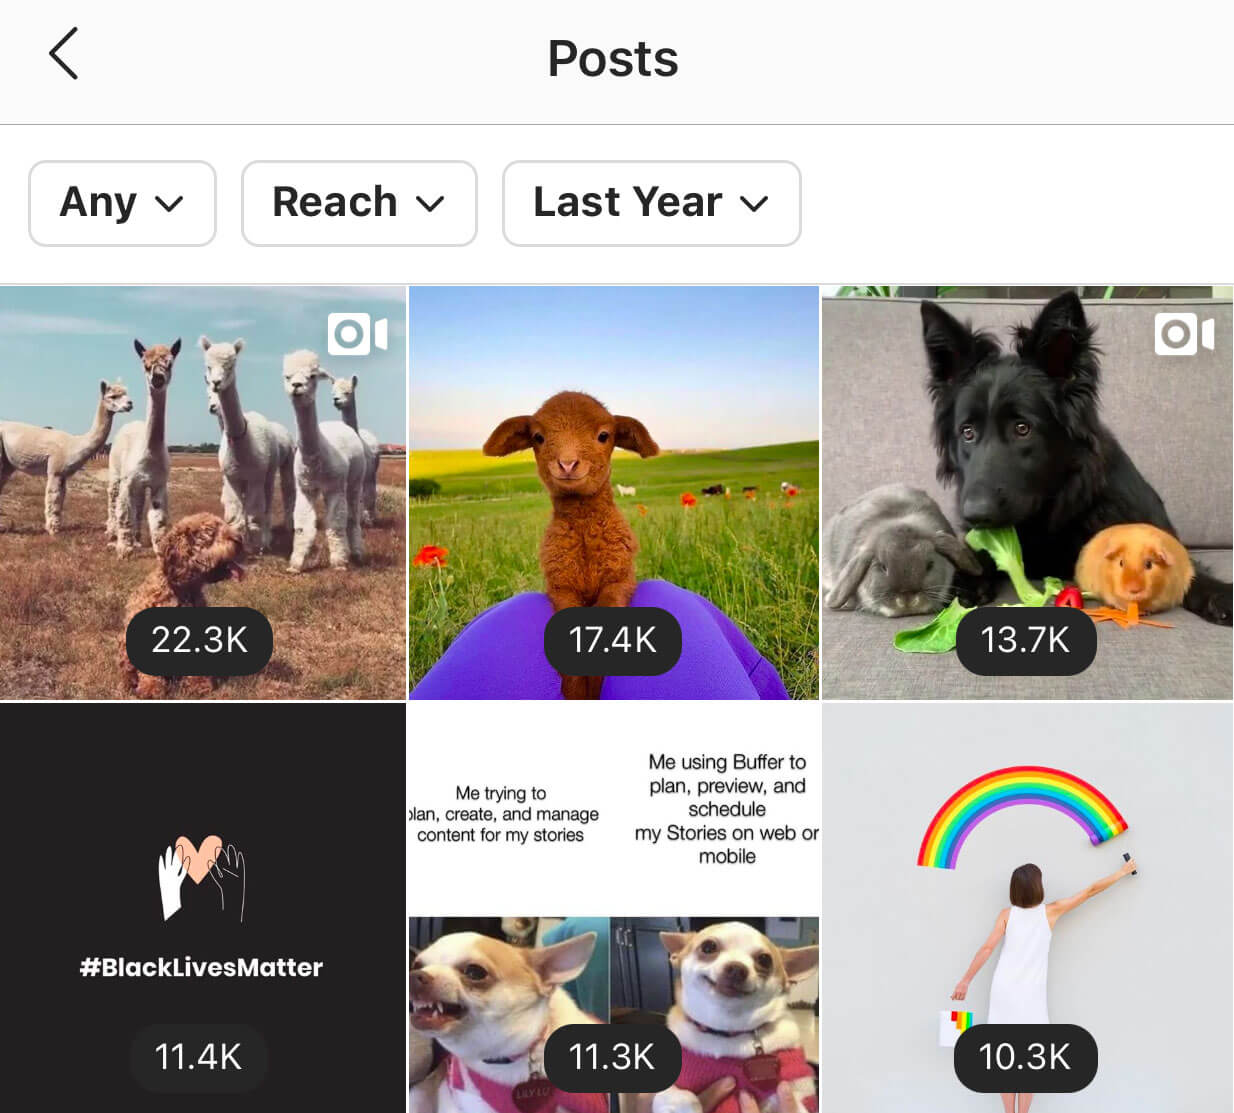
Using Instagram Insights, you can easily find your top Instagram stories and posts based on impressions, reach, and engagement. Once you’ve sorted your top posts, do you notice any trends?
For instance, our giveaway posts tend to generate the most comments, while user-generated landscape photos usually receive the most engagement. To drive more engagement, we can continue to post landscape photos from our community.
You can also dig into your Instagram demographics and turn to your audience for guidance with content. For example, HIKI, a company with a full-body sweat line, leverages polls and questions in Instagram Stories to gather feedback from their audience.
Tinah Ogalo, HIKI’s social media coordinator, says she keeps a close eye on pop culture and the HIKI community for inspiration. And since HIKI’s audience is predominantly Gen Zers and millennials, HIKI speaks to that demographic.
Tell better Instagram Stories
Instagram Insights provides data such as impressions, exits, and replies, which you can use to tell better Instagram Stories.
While each audience’s attention span will differ depending on a variety of factors, we discovered some trends by analyzing 15,000 Instagram Stories. Here are some key takeaways:
- People are most likely to exit Instagram Stories on the first or last post, so make sure you hook your audience at the beginning.
- Stories with 1–7 posts have higher completion rates—try not to overwhelm your followers with too much at once.
- People tend to watch Instagram Stories outside of work hours. Stories only stay live for 24 hours, so make every hour count by posting when people are most active.
Take a close look at the content that gets higher impressions, replies, and reactions. Is there a type of story that tends to do better than the rest? Is there a common point when most of your followers exit your stories?
For example, some audiences might respond better to videos versus photos or stick around longer if you provide text captions along with your audio. Play around with different formats and continuously check your Instagram analytics to see what gets the most love from your followers.
Experiment with Instagram IGTV, Instagram Live, and Instagram Reels
While Instagram analytics get a bit murky with these formats—particularly with Instagram Live and Instagram Reels—it’s still worth incorporating them into your Instagram marketing strategy.
Instagram limits videos in your feed to 60 seconds, but Instagram TV (IGTV) allows you to share videos up to 60 minutes long in your feed. This is a great way to integrate long-form videos that have a permanent spot in your feed so you can keep an eye on metrics such as views, interactions, reach, and shares.
Instagram Live is a subset of Instagram Stories with a key difference: Live videos completely disappear from your profile as soon as you end the broadcast. While Instagram Insights does not offer analytics after an Instagram Live video ends, you can be strategic before and during a Live. Beforehand, you can open up Instagram Stories and toggle to “Live” to see how many of your followers are actively using the Instagram app. This gives you a general idea of how many people will receive a notification about your Instagram Live. During the broadcast, you’ll see the total viewers, so you can take screenshots to preserve the data.
Instagram Reels is the newest format and, as of October 2020, is not included in Instagram Insights. However, you can view likes and comments. The main benefit of these multi-clip 15-second videos is that they’re discoverable via Instagram Explore and through featured Reels, giving you a chance to reach new viewers.
How do you monitor Instagram analytics?
Whether you use paid or free Instagram analytics tools, there are so many ways to dig into Instagram metrics and make more data-driven decisions.
We may be biased, but we think Buffer's analytics a pretty great way to gather and interpret data. But you don’t have to take our word for it—you can see for yourself with a free 14-day trial.


