


I love to see new stats and research about how to best share to social media.
If it’s research-backed or numbers-driven, sign me up. These actionable tips are what drive a lot of our experiments at Buffer as we’re keen to see if the best advice from these studies meshes with our experience, too.
And there’s a lot of new info to go off of.
I’ve collected 10 of the latest surprising, revealing studies on social media here in this post, with takeaways and insight into social media timing, Instagram sharing, Facebook users, and more. If you’ve seen a recent study worth mentioning, I’d love to hear from you!
1. The peak performance of social sharing
Late afternoon to nighttime is the best time to reach people on social
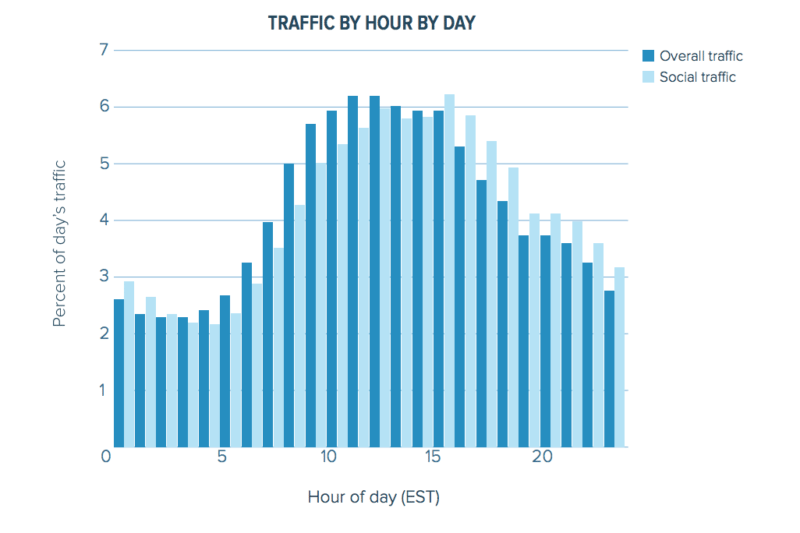
Social traffic substantially underperforms overall traffic from about 5 a.m. to noon, and social substantially overperforms overall traffic from about 3 p.m. until 1 a.m.
Chartbeat reported on the data of the sites it tracks, looking at how social media sharing corresponds to site traffic. The general trend seemed to follow: Traffic and social sharing both increase throughout the early morning, peak midday, then lessen into the evening.
The unique finding here was in the subtle difference in exactly where each metric peaks.
Social traffic outperforms website traffic from 3:00 p.m. Eastern Time to 1:00 a.m.
2. What the average Facebook user looks like
The very male, college-educated, heavily IT, somewhat liberal demographic
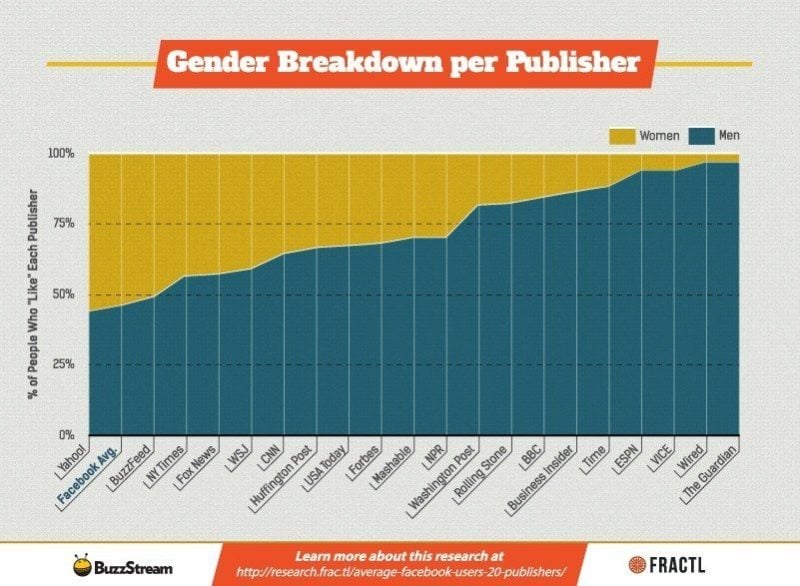
Only two publishers–BuzzFeed and Yahoo!–have more women than men in their audiences at 51% and 56% respectively.
Only two publishers–Forbes and Wired–exceed a 10% likelihood in their audiences working at management level.
Fractl and BuzzStream collaborated on a study of 20 publishers’s Facebook audiences, looking at the Audience Insights for publishers like The Guardian, Wired, BuzzFeed, Yahoo, Huffington Post, and more.
In the case of these audiences, the results skewed heavily in a few directions:
- 18 of the 20 publishers had an audience that was more male than female.
- The majority of active users on these pages has graduated from college.
- All but one publisher had an audience makeup of more IT workers than the U.S. Facebook average.
Comparisons might be a little tricky to draw between these pages and yours, though the research does point to the value of understanding your audience. My best guess at the demographics of some of these publishers would be that the audience was more female (I was wrong) and perhaps not as IT focused.
3. Instagram vs. Facebook
Instagram a more engaged platform than Facebook, Twitter
Instagram leads social platforms for engagement with 2.81% of audiences engaging with a post.
Locowise studied 2,500 Instagram profiles from April 2015 to measure a wide assortment of different engagement metrics and content strategies. One of the big takeaways was how engagement on Instagram far outperforms Facebook and Twitter.
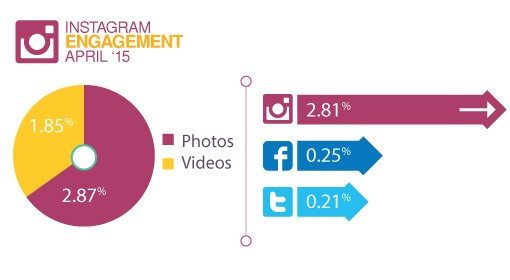
Average engagement per post on Instagram was 2.81%.
On Facebook, engagement was 0.25%.
On Twitter, engagement was 0.21%.
(For Instagram engagement—as you can see from the graph above—the best results still come from photos versus video.)
Other interesting takeaways from the Locowise study include:
- Likes account for 96% of all engagements (comments account for the other 3%)
- Brands post 2.3 times per day to Instagram
- The largest profiles post 7.24 times per day, the smallest profiles post 1.68 times
- Average follower growth month-over-month is 1.95%, meaning that if you had 1,000 followers in March, you could expect to gain 19 new followers in April.
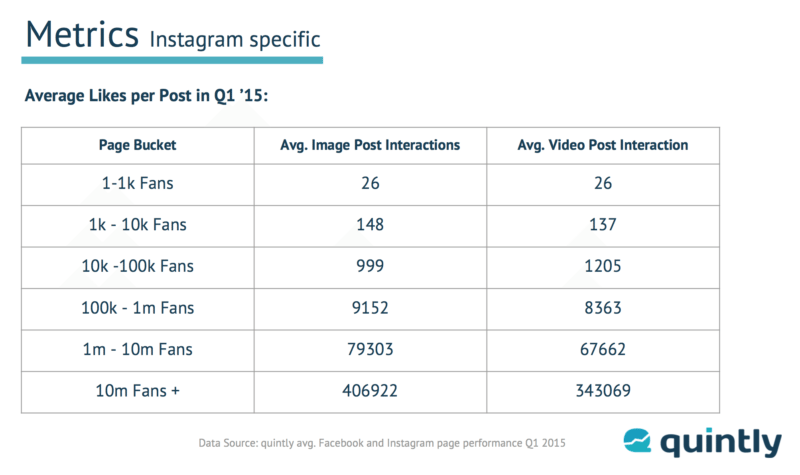
4. Interactions and Instagram
More interactions happen on Instagram—5 likes or comments for every 100 followers
The average interaction % on Instagram is up to 10 times higher than on Facebook.
Quintly analyzed over 5,000 Instagram accounts (and broke those accounts into buckets of followers, too) to see the current trends in engagement, content type, and strategy. One of the main takeaways from the study: Interactions are amazingly high on Instagram.
Quintly measured Interaction Rate, which is interactions per post divided by number of followers. They found that Instagram’s Interaction Rate was 4.80 interactions per 100 followers. Facebook’s rate is 0.72.
Further, Quintly also shared the average interactions per post for Instagram photos or videos, along with a breakdown of what you might expect at varying follower levels.
5. Where is social media marketing headed?
Survey says Twitter, YouTube, & LinkedIn
Social Media Examiner surveyed over 3,700 marketers on their social media strategies, goals, and plans, ending up with some truly fascinating results on where social media marketing may be headed.
A significant 66% of marketers plan on increasing their use of Twitter, YouTube, and LinkedIn.
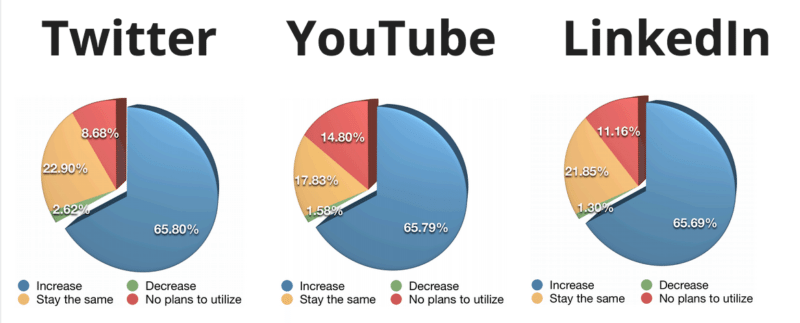
Additional cool findings from the Social Media Examiner survey include:
- Marketers are most keen to learn about Facebook
- Nearly 3 out of every 4 marketers plans to increase video usage
- Facebook and LinkedIn are the two most important networks for marketers
- Most marketers aren’t sure their Facebook marketing is effective
6. On reposting content
How to get more engagement with a second tweet
We’ve written much before about the case for reposing content, sharing an article more than once on social media. A research team from Cornell investigated this strategy, looking at the effect of wording on sending multiple messages through Twitter.
The researchers developed an algorithm that could successfully predict which variation of the same tweet would receive more retweets. (You can try out the free tool that is based on the algorithm.)
Here are the factors that researchers identified as being helpful for reposted content. (The most significant factors are highlighted in bold.)
- Ask people to share – Use words like “RT, Retweet, spread, please”
- Informativeness helps – Focus on length, nouns, and verbs (and not so much @-mentions or hashtags)
- Make your language align with both community norms and with your prior messages
- Mimic news headlines
- Use positive and/or negative words (both seemed to work equally well)
- Use third-person singular – He, she, it, and one
- Generality helps – Use indefinite articles like a, an
7. Twitter images for smaller accounts
The 9x increase in retweets just by adding an image
In a huge Twitter analysis by Stone Temple Consulting—over 2 million tweets analyzed for eight different factors, including unique things like domain authority and Followerwonk social authority—the authors discovered a few insightful trends, perhaps none more actionable than the power of tweets with images.
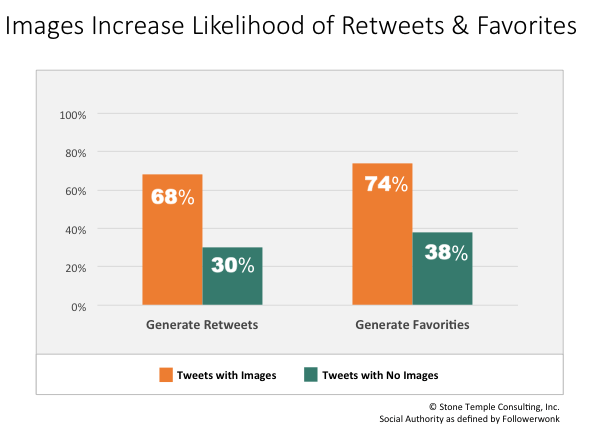
According to Stone Temple’s study, adding an image to your tweet doubles the likelihood that your tweet will receive a retweet or favorite.
And for those with low-level social authority—low follower counts, just getting started on Twitter, or otherwise—adding an image to your tweet generates 5 to 9 times as many retweets and 4 to 12 times as many favorites in total.
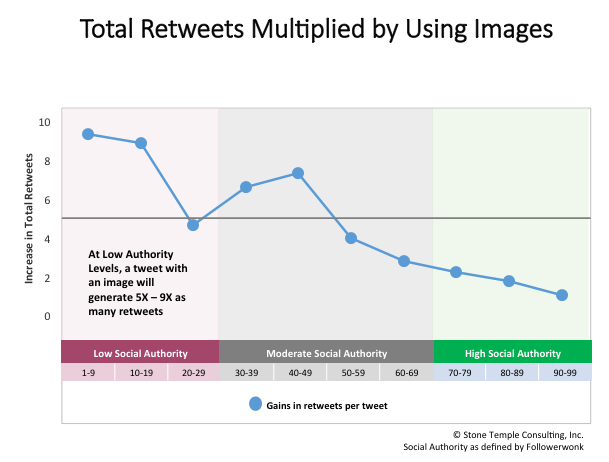
From Eric Enge of Stone Temple:
At lower authority levels including an image will get you 5 to 9 times as many Retweets and 4 to 12 times as many favorites than you will if your tweets don’t include an image. Hopefully, you were sitting down when you read that. Note that high authority levels also benefit as well, though for the 90-99 range the gain is relatively modest. For those high authority accounts, people are already hanging on their every word.
8. The top social networks
The surprising result at #1, plus the unique spot for Twitter
The Global Web Index’s most recent quarterly report (a survey of more than 40,000 Internet users) looked at social media usage and came out with a couple keen insights.
- More Internet users visit YouTube than Facebook.
- YouTube and Twitter have significantly more visitors than active users.
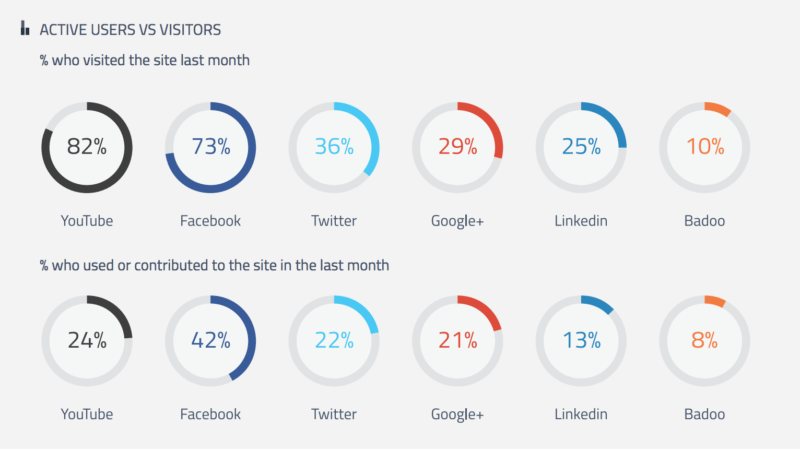
So in case you had yet to consider YouTube as a possible channel to meet your audience, there seems to be solid evidence here that your audience is quite familiar and comfortable with hanging out at YouTube. (We’ve got some tips on how to make videos for your brand also, if that’d be interesting for you!)
And as for the drop in active users for YouTube and Twitter, I like to think of this in terms of consumption versus sharing. Someone may be on Twitter to hear the latest news, click some links, see what’s happening—they may still be engaged with your Twitter stream without contributing anything of their own to Twitter.
We covered a series of social media personality types awhile back, and these folks seem to fit well into the lurker category—still a valuable addition to your network, just with their own personal tastes when it comes to being involved.
9. How people spend their time on social
Twitter is for news, Facebook is for friends
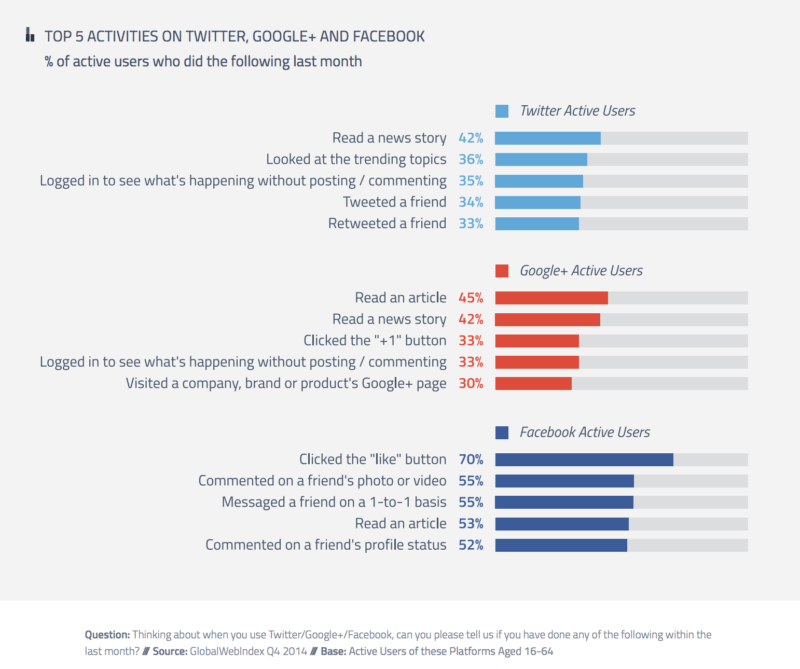
Another interesting takeaway from the Global Web Index report is in the survey responses about how people spend their time on social media sites. For Twitter, Facebook, and Google+, the report found the following:
- The most popular activity on Twitter is reading a news story
- The most popular activity on Facebook is clicking the “Like” button
Here’s how the rest of the activity breaks down. Note how many of the top Twitter activities deal with reading the news or catching up on what’s been happening whereas many of Facebook’s top activities involve connecting with friends.
10. Make waves by responding quickly
5 in 6 messages that need responses are not answered by brands
Sprout Social regularly shares insights from its data, making particular note about the way that brands and businesses listen and respond on social media. Their 2013 benchmark study showed great room for brands to improve, and Sprout’s followup study in 2014 had many of the same takeaways.
There is great opportunity for you to stand out on social media by simply replying to everyone.
The data from Sprout Social showed that businesses are learning how to reply quicker to responses (we’ve mentioned before that response expectations on Twitter typically hover under 60 minutes). However, they’re replying to a smaller percentage of the volume of messages they receive.
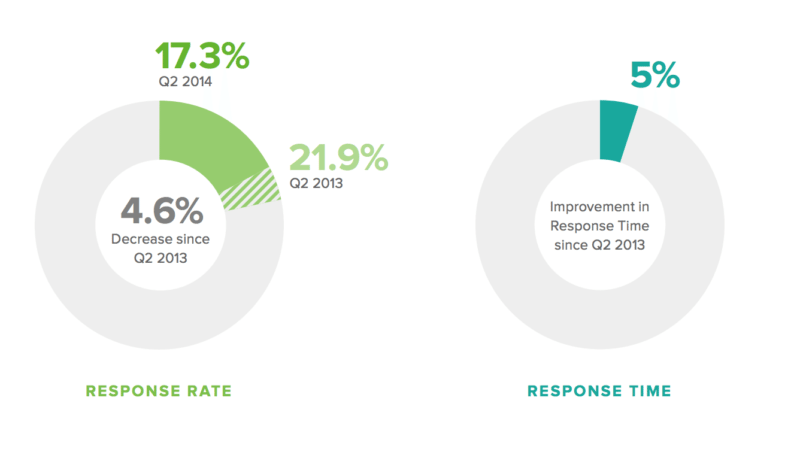
- Response rate: 17% (was 21% one year ago)
- Response time: 5% improvement from previous year
Over to you
Which of these stats stand out to you?
Is there anything here that seemed particularly surprising or true from your experience?
I’d love to hear your thoughts in the comments! Feel free to leave any input you might have, it’d be great to hear from you.
Image sources: Pablo, IconFinder, UnSplash
Try Buffer for free
140,000+ small businesses like yours use Buffer to build their brand on social media every month
Get started nowRelated Articles

In this article, Nupur Mittal shares insights into four research methods that help her find content ideas and identify unique takeaways.

Facebook marketing in 2019 isn’t dead. On the contrary, it’s far from it. Now removed from the dim outlook that businesses faced at the beginning of 2018, Facebook has and will remain an essential tool for brands’ marketing strategies moving forward. In our big State of Social Media 2019 Report, we found that 93.7 percent of businesses use and are currently active on Facebook — the most among any other social media network. And although we continue to see a dramatic rise in the usage