


When I choose someone new to follow, when I compose a new tweet, when I share and favorite an update, I seldom think about the why. My following sessions would probably seem haphazard to an outsider, and my favoriting technique comes and goes from one strategy to another.
Even so, the way I use Twitter is far less random than I thought. There is science and psychology behind the way we all tweet.
Researchers have discovered trends in the way that we perform every major action on Twitter—favoriting, updating, sharing, and following. And there’s even an interesting bit of psychology behind what makes Twitter so attractive in the first place. Here’s a look at the psychology of Twitter: what makes us follow, favorite, share and keep coming back for more.
Why we love Twitter so much: Rats, levers and psychology
I’ve hit more than my fair share of Twitter wormholes—minutes that turn to hours as I find more and more tweets to read and share. Does that sound familiar to you, too?
I figured there was a psychological reason behind the draw of Twitter. After digging around, sure enough, I came across a perfect explanation of this phenomenon, courtesy of Dr. Marion Underwood, a clinical psychologist at the University of Texas.
The type of reinforcement schedule that is the most reinforcing is what’s called an intermittent schedule.
So, you have a rat pushing a lever and he gets rewarded, but not in a predictable way. Many times, that animal pushes that lever and nothing comes, but every once in a while, it gets a great treat. So the rat keeps pressing and pressing and pressing even though there’s not much reinforcement coming because every once in a while, it’s just great.
This hit home for me. Twitter offers these intermittent rewards that keep us coming back. Maybe you’ll check Twitter once and have a notification that someone retweeted you. That’s enough to keep you coming back a handful more times, even if nothing new and rewarding has occurred. We keep pushing the lever, hoping for something great.
The concept makes complete sense for those who wind up checking Twitter multiple times each day (same goes for email, too).
And just as there is psychology behind why we love Twitter so much, there’s science and data behind the many different ways we interact with one another. Here are three of the most interesting studies I’ve come across.
Why we follow: The 15 factors that affect follower growth
What spurs us to follow someone on Twitter? Researchers at Georgia Tech and Michigan combined to study the factors involved in following.
Their study looked at more than 500 Twitter users and a half-million of their tweets and analyzed follower count over a 15-month period—one of the longest timeframes you’ll see in a Twitter study.
The research team worked from a basis of follower growth factors that were made up of variables from social science, linguistics, computer-mediated communication, and network theory. In other words, if there is any reason why someone would follow someone else on Twitter, this study accounted for it.
The factors they came up with boiled down to three categories: social behaviors, message content, and social network structure. Here are the individual factors for each, starting with social behaviors:
- Tweet volume
- Burstiness – tweets per hour
- Interactions – replies, mentions, and favorites
- Broadcast communication – the ratio of tweets with no @-mention
- Trustworthiness of the profile – How well is the bio filled out? Is there a URL in the profile? Is there a location listed?
The individual factors for message content:
- Positive/negative sentiment
- Informational content – ratio of tweets containing either a URL, RT, MT, HT, or “via”
- Meformer content – ratio of tweets containing self-referencing pronouns like “I,” “me,” “we,” and “us”
- Topic focus
- Retweets – how often your content gets retweeted
- Hashtag usage
- TReDIX – Tweet Reading Difficulty Index (based on the frequency of real English words longer than 6 letters)
The individual factors in social network structure:
- Reciprocity – The number of people you follow who also follow you
- Attention-status ratio – Total followers compared to total following
- Network overlap – How similar are the people you follow to those a follower follows
Knowing what’s behind each of these factors, how would you rate them in terms of importance? Which factor helps gain the most followers?
The winner is network overlap.
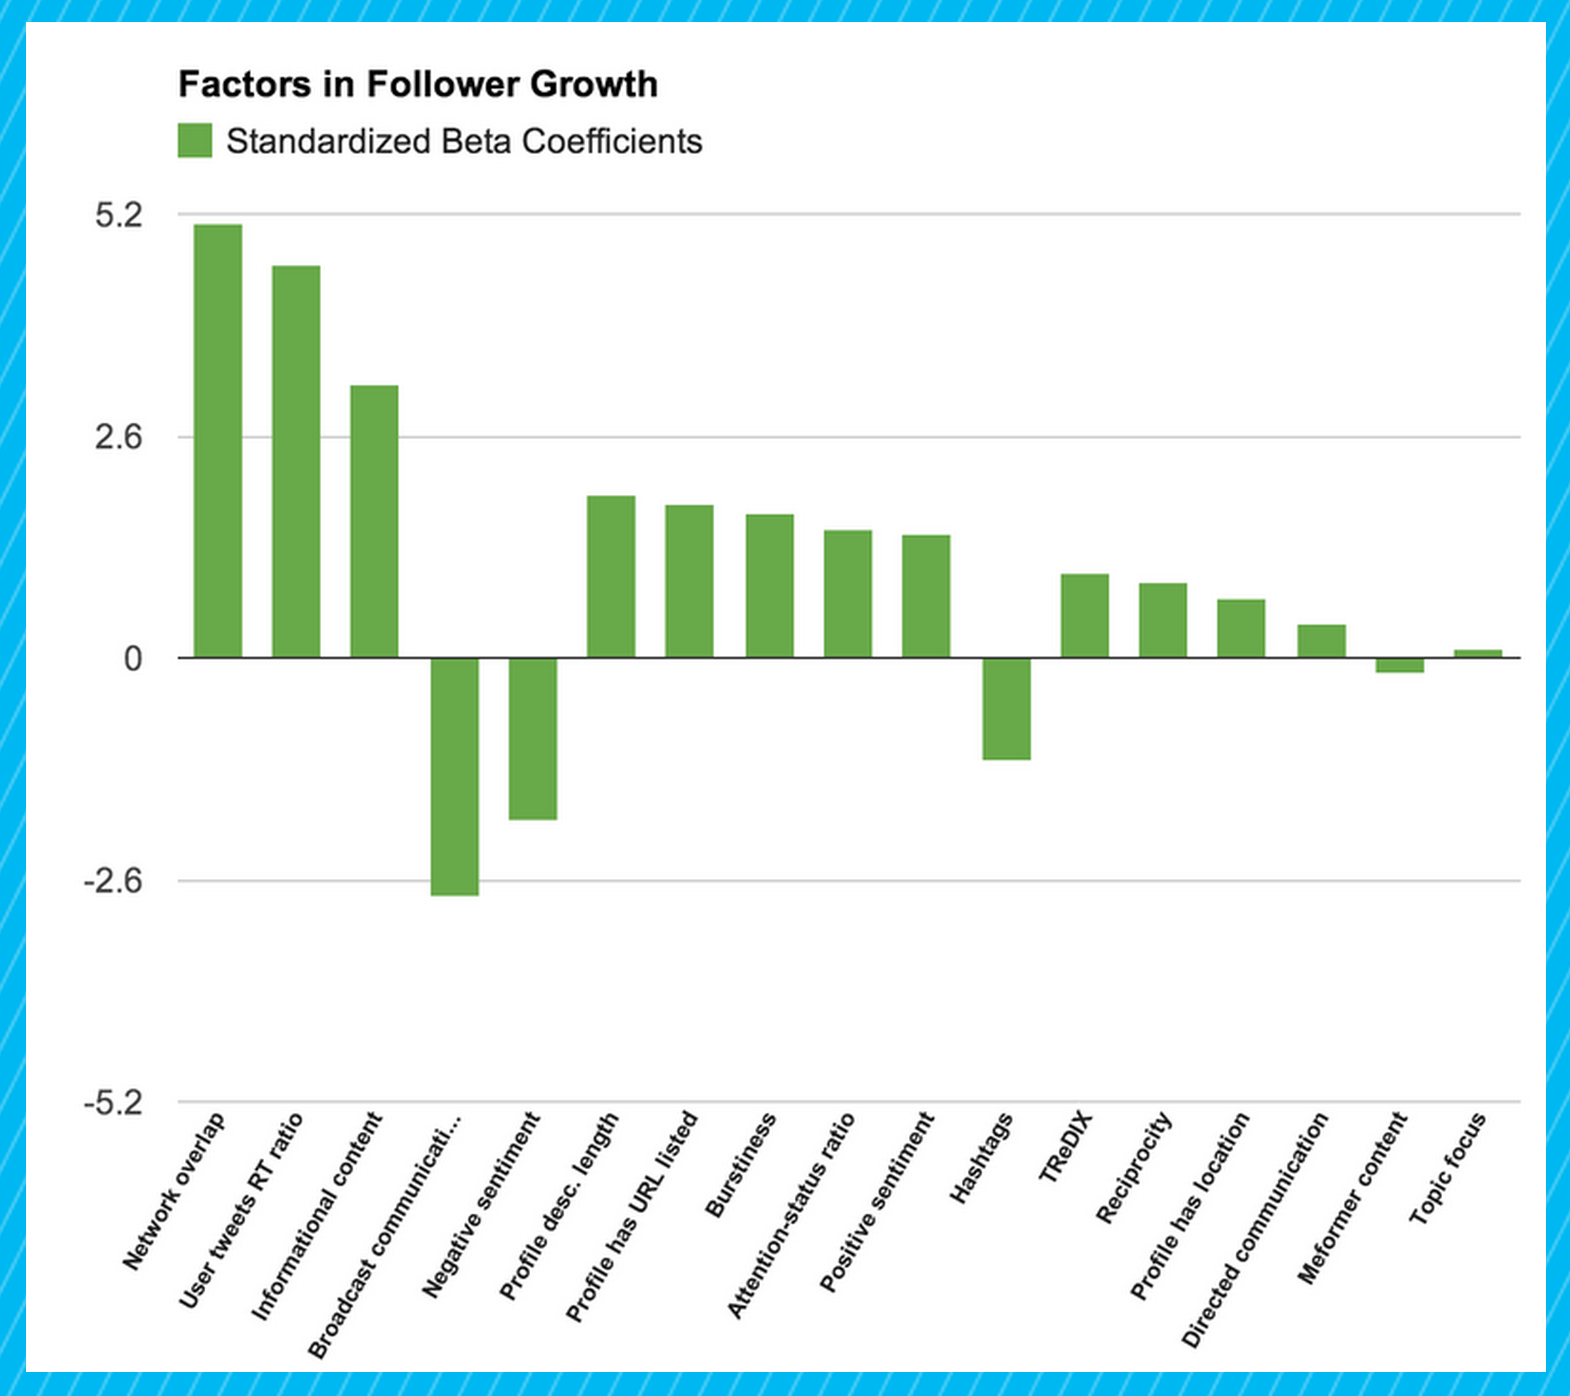
In the chart above, you’ll see that the effect on follower growth spills to both sides of the x-axis. So not only can you see that network overlap, retweetable content, and a good bio have positive effects on gaining followers, you might also notice that broadcast communication (e.g. tweets with no @-mention), negativity, and hashtags drive follower growth down.
Takeaway: The PsyBlog has a nice recap of the findings from this study, summarizing points of emphasis from the research data. If you want to grow your followers, try these tips:
- Avoid negative sentiments
- Inform, don’t meform
- Boost social proof
- Stay on topic
- Write well and avoid hashtag abuse
- Switch from broadcast to direct tweets
Why we share: A guide to penning the most shareable tweet
I’m sure we’d all love to know what makes for a perfect tweet. Cornell researchers were interested, too.
They conducted a study that examined more than 1.7 million tweet pairs, comparing the differences in language between the two tweets and assigning value based on which style of tweet gains more retweets. Their conclusion:
Helpful wording heuristics include adding more information, making one’s language aligned with both community norms and with one’s prior messages, and mimicking news headlines.
If you were looking for an exact formula of a perfect tweet, the researchers didn’t find one. They did, however, offer a large number of best practices to go along with their conclusion above.
- It helps to ask people to share
- Informativeness helps
- Sound like your community
- Imitate headlines
- Refer to other people but not to your audience (“he” and “she” rather than “you”)
- Generality helps (“a” and “an” rather than “the”)
- The easier to read, the better
Perhaps best of all, the research team put together a tool based on their findings that can help you perfect your posts. Enter two similar tweets into the Retweeted More tool, and you’ll get an algorithmic answer about which is better.
(Ready for some practice? See how you fare against the algorithm by taking this 25-question test–see if you can pick the tweets that got shared more.)
Takeaway: Take inspiration from headlines and from your past successful tweets (your Buffer analytics can help with this) to write a tweet that is optimized for sharing. Try out the Retweeted More tool to test different versions.
(If you’re curious what we’ve found works best for retweets, check out the recap from our Twitter webinar.)
Why we favorite: Reaction & function
A study published by the Association for the Advancement of Artificial Intelligence sought to put our myriad favoriting methods into categories. They quizzed a group of more than 600 Twitter users by asking two questions:
- Explain why you tend to favorite tweets.
- Explain the reasons for your most recent favorited tweet.
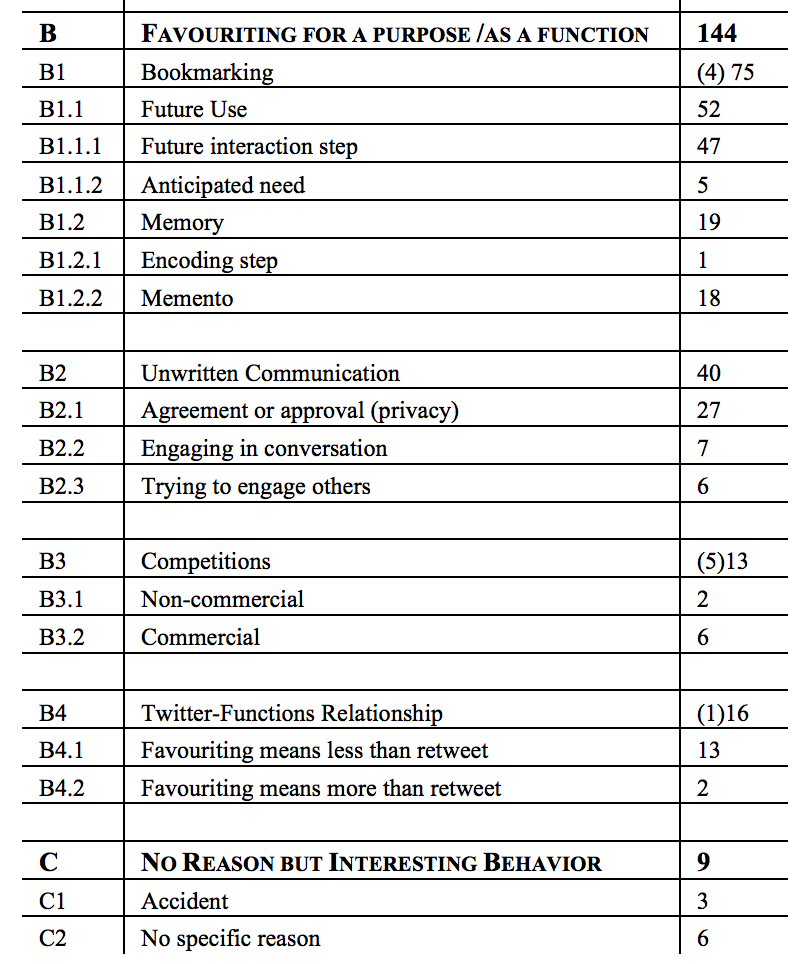
They received more than 331 answers to these questions and placed each answer into one or more categories. Here’s the full taxonomy of categories they used to classify favorites.
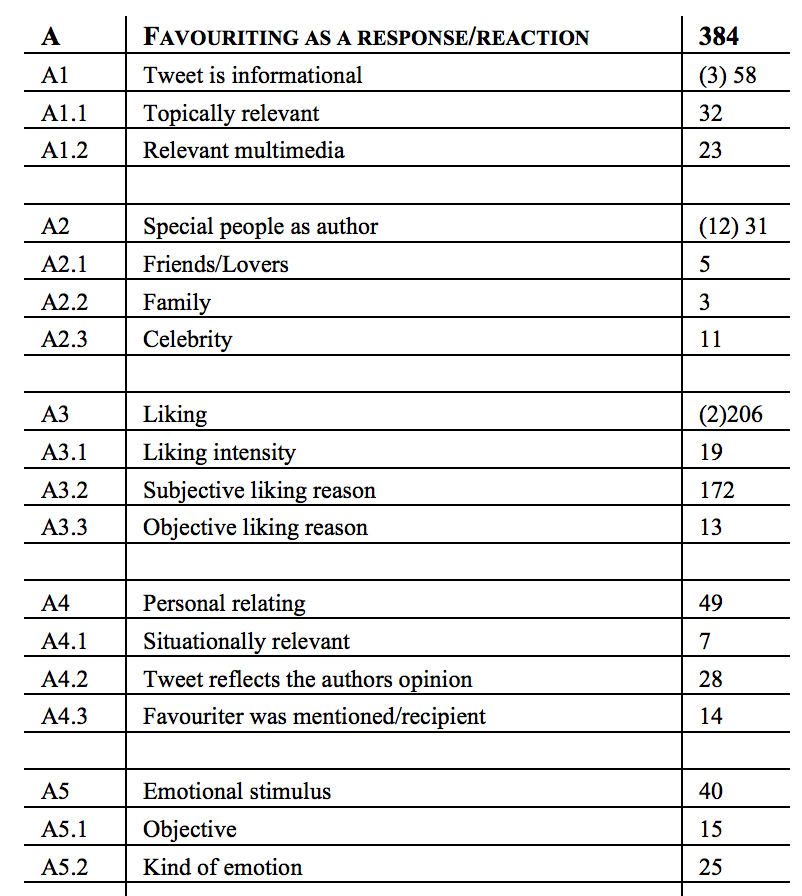
What’s interesting about the way these 331 answers fell is that there came about two distinct use cases for favorites. The research found that people favorite a tweet for one of two reasons:
- Reaction/response
- Function/purpose
The psychology here is quite interesting. Reactions and responses occur directly due to the content of the tweet or the author of the tweet. We favorite what we like. We favorite our friends and family (and, if I’m being honest, celebrities). When we favorite for utility, we’re seeking to fulfill a goal or a purpose. We favorite to bookmark. We favorite to communicate.
(If you’ve ever favorited something you agree with, your favorite would fall into the function/purpose category. According to the study’s authors, favoriting as agreeing is intended for the author; liking for the person doing the favoriting.)
Takeaway: Classifying favorites is nothing new; we all seem to have a method of favoriting tweets. The research shows, at least, that our method isn’t necessarily unique to us. For every user who favorites their friends, there’s a user who’s favoriting for bookmarks.
Do these insights ring true to you?
Psychology shows us how Twitter can be so addicting: We crave a great experience each time we pull the Twitter lever, and it keeps us coming back for more.
Research and data reveal a bit into the way that we use Twitter. We follow based on our network, we retweet based on tried-and-true formulas, and we favorite for reaction or function.
How do these Twitter findings fit with your experience? I’d love to hear your thoughts in the comments or on Twitter.
Image credits: See-ming Lee, AAAI
Try Buffer for free
140,000+ small businesses like yours use Buffer to build their brand on social media every month
Get started nowRelated Articles

In this article, Nupur Mittal shares insights into four research methods that help her find content ideas and identify unique takeaways.


Facebook marketing in 2019 isn’t dead. On the contrary, it’s far from it. Now removed from the dim outlook that businesses faced at the beginning of 2018, Facebook has and will remain an essential tool for brands’ marketing strategies moving forward. In our big State of Social Media 2019 Report, we found that 93.7 percent of businesses use and are currently active on Facebook — the most among any other social media network. And although we continue to see a dramatic rise in the usage