
2024 Social Media Benchmarks You Should Use to Guide Your Strategy
This article looks into social media benchmarks for various industries and platforms.


How do you know the number of likes, comments, and shares you’re getting is good enough? Your social media results don’t exist in a silo. To get the full picture, you need to compare your metrics to other businesses that look like yours.
This article will delve into social media benchmarks for various industries and platforms. I’ve used data from the following reports:
- Buffer’s best times to post on social media — which analyzed one million posts sent through Buffer
- RivalIQ’s 2024 social media industry benchmark report — which analyzed 2,100 from over 14 industries
- Buffer’s best content for major social media platforms — which analyzed one million posts sent through Buffer
⚠️ Remember that each research analyzes different companies and has varying numbers of posts — so the metrics you read here are a guideline, not a commandment.
What do social media industry benchmarks mean?
Social media industry benchmarks are a lever against which you can measure your own performance. Let’s say you’re a small business in the education industry on TikTok.
- If your engagement rate is at par with most other educational small businesses on TikTok, you can feel confident in your social media strategy. You’ll double down on what you’re already doing and witness a steady return-on-investment (ROI).
- If you were looking at your engagement rate in a silo, you would’ve no benchmark to compare it to — except your own past performance. While that’s certainly useful, it’s not enough. How can you understand the scope of your improvement if you have no other data to compare your results to? Maybe your engagement rate is better than last quarter, but it’s still significantly lower than others in your industry. Knowing this fact can help you address the problem and determine where you can get better results.
Social media benchmarks help you see your performance in full context. Knowing the industry standard can help you set ambitious but achievable goals, report a 360-degree picture to leadership, and pinpoint areas of growth.
Which social media metrics should you care about?
The X-axis is your industry. Which metrics should you look for in the Y-axis? Here are four social media marketing metrics you should care about:
1: Engagement rate
Engagement rate is typically calculated as the total number of likes, comments, and shares divided by the total number of followers multiplied by 100.
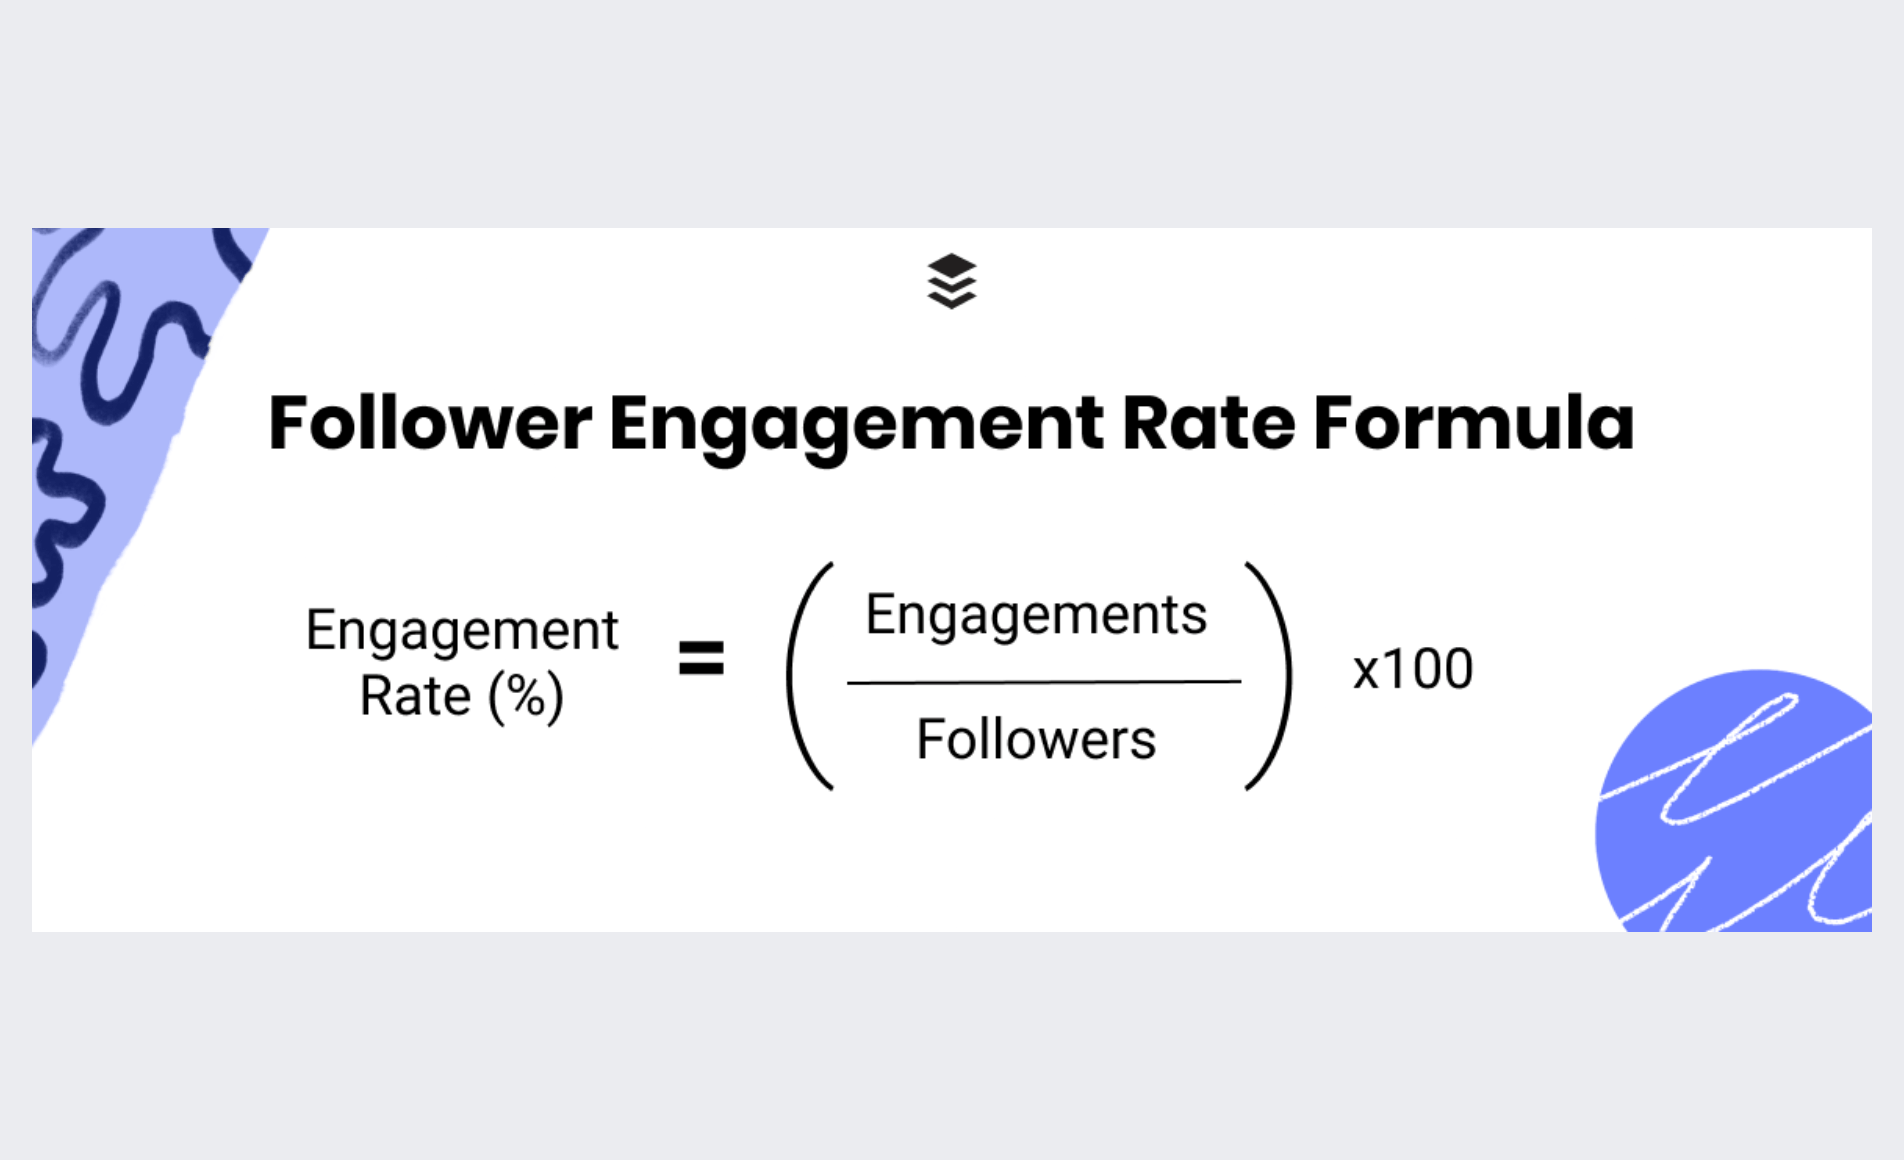
Why should you care about social media engagement rate? The number of interactions your posts receive determines whether your target audience resonates with your social media content. The higher the engagement rate, the more your followers like your social media posts.
2: Post type
Many social networks today have a ton of content formats — images, carousels, videos, etc. Understanding which type of post works best for which platform helps you repurpose content efficiently and prioritize the right type of content types for your social media calendar.
3: Posting frequency
Posting frequency is the number of times you should post on a social media platform. There’s an ideal post frequency for every network to get the most engagement, but it’s not always consistent across industries. Some niches might need to post more because their industry has a lot of competition on social media, while others might not need to be so strict with how often they post.
4: Posting times
There’s no universal right time to post on social media, but there are certain times when you might get more engagement than others — just because the algorithm supports it. Benchmark data helps you understand the “best time to post” patterns spotted from millions of posts.
While these are the four key metrics I’ve shared above, the benchmark data you care for can vary depending on your social media goals.
For example, if your goal is to increase your follower count, you might also care about doing a competitive analysis of follower growth in your industry. If your aim is to improve brand awareness, you might also want to monitor impressions and reach.
Breaking down social media benchmarks by platform & industry
I’ll break down the social media benchmarks for various industries for the most popular social media sites.
Social media benchmarks for Facebook
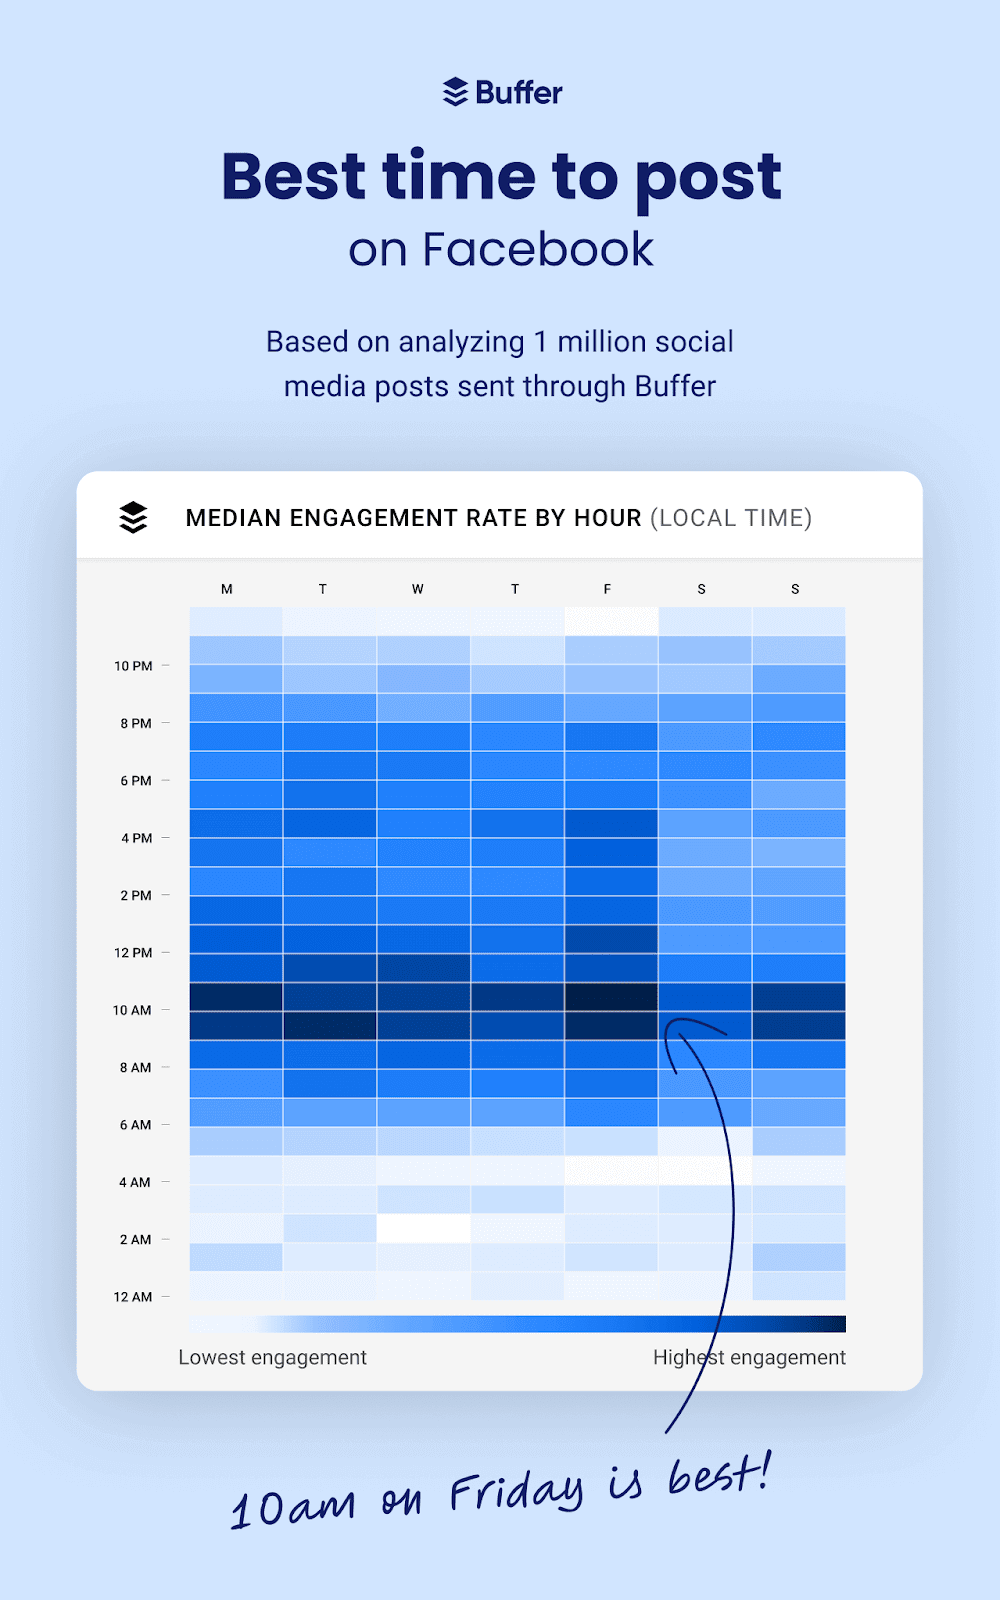
The best time to post on Facebook is 10 AM on a Friday, according to Buffer’s analysis of a million posts.
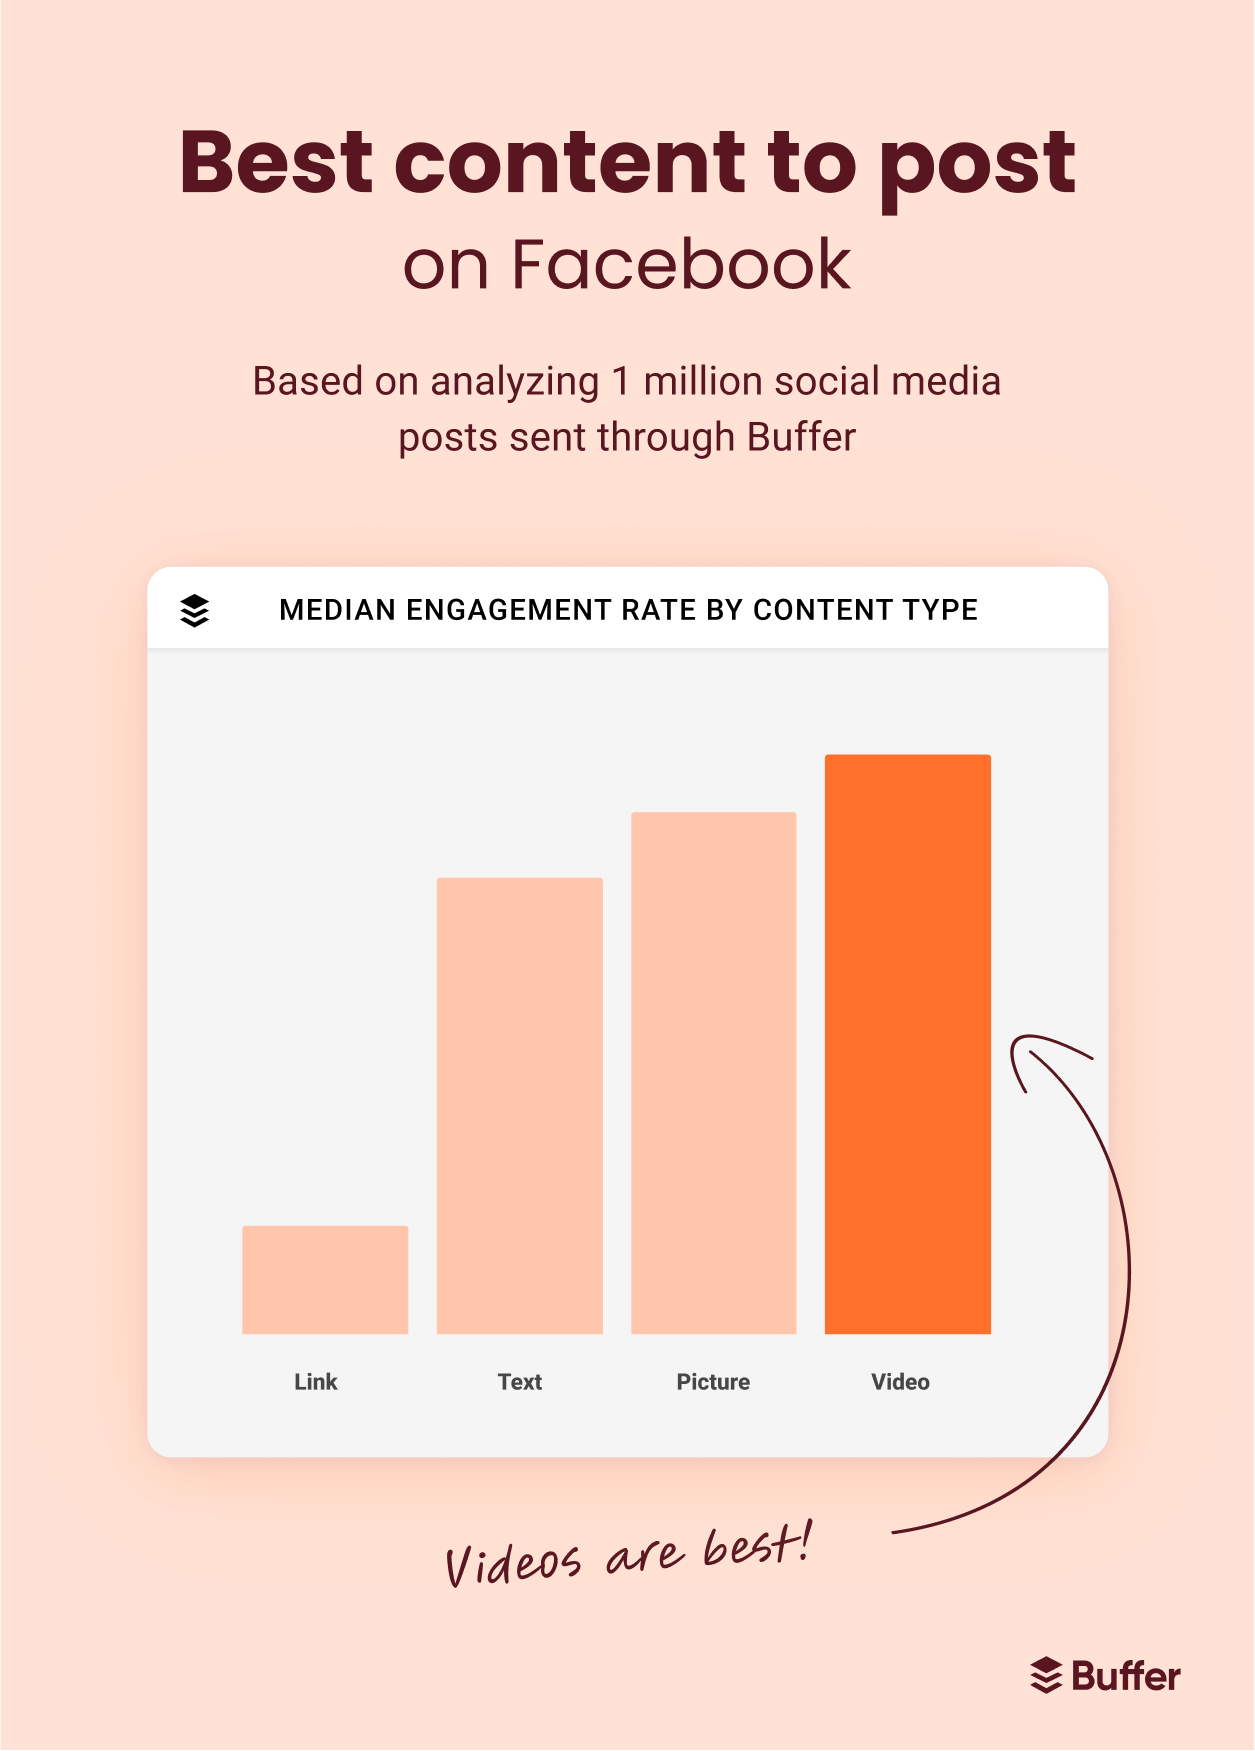
According to another one of Buffer’s posts, video gets the most engagement on Facebook.
Brands are posting 4.69 times weekly on Facebook, according to RivalIQ. Companies in the media industry post the most, followed by sports.
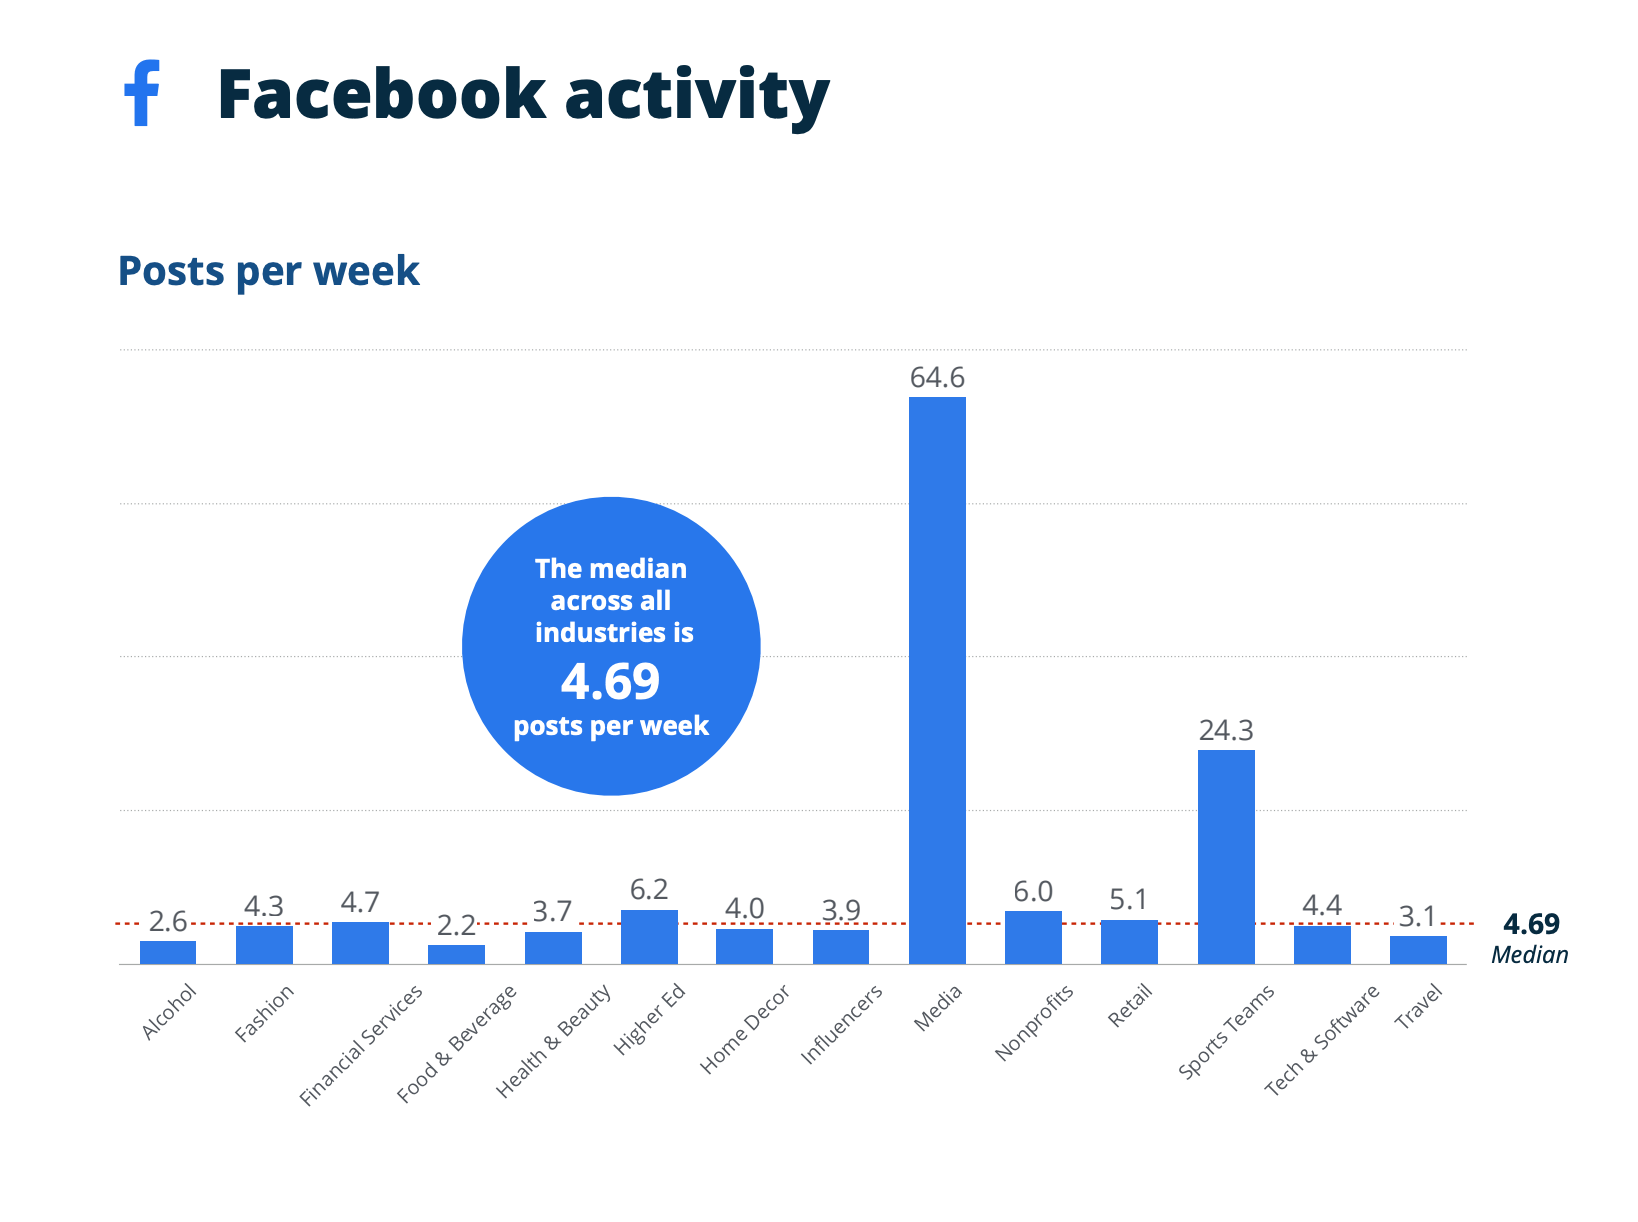
RivalIQ’s engagement rate was not in alignment with the posting frequency. Despite posting the most often, brands in the media industry don’t get the highest engagement rate (0.04 percent). Sports teams get the highest engagement, followed by influencers and higher education. The median engagement rate across all industries is 0.063 percent.
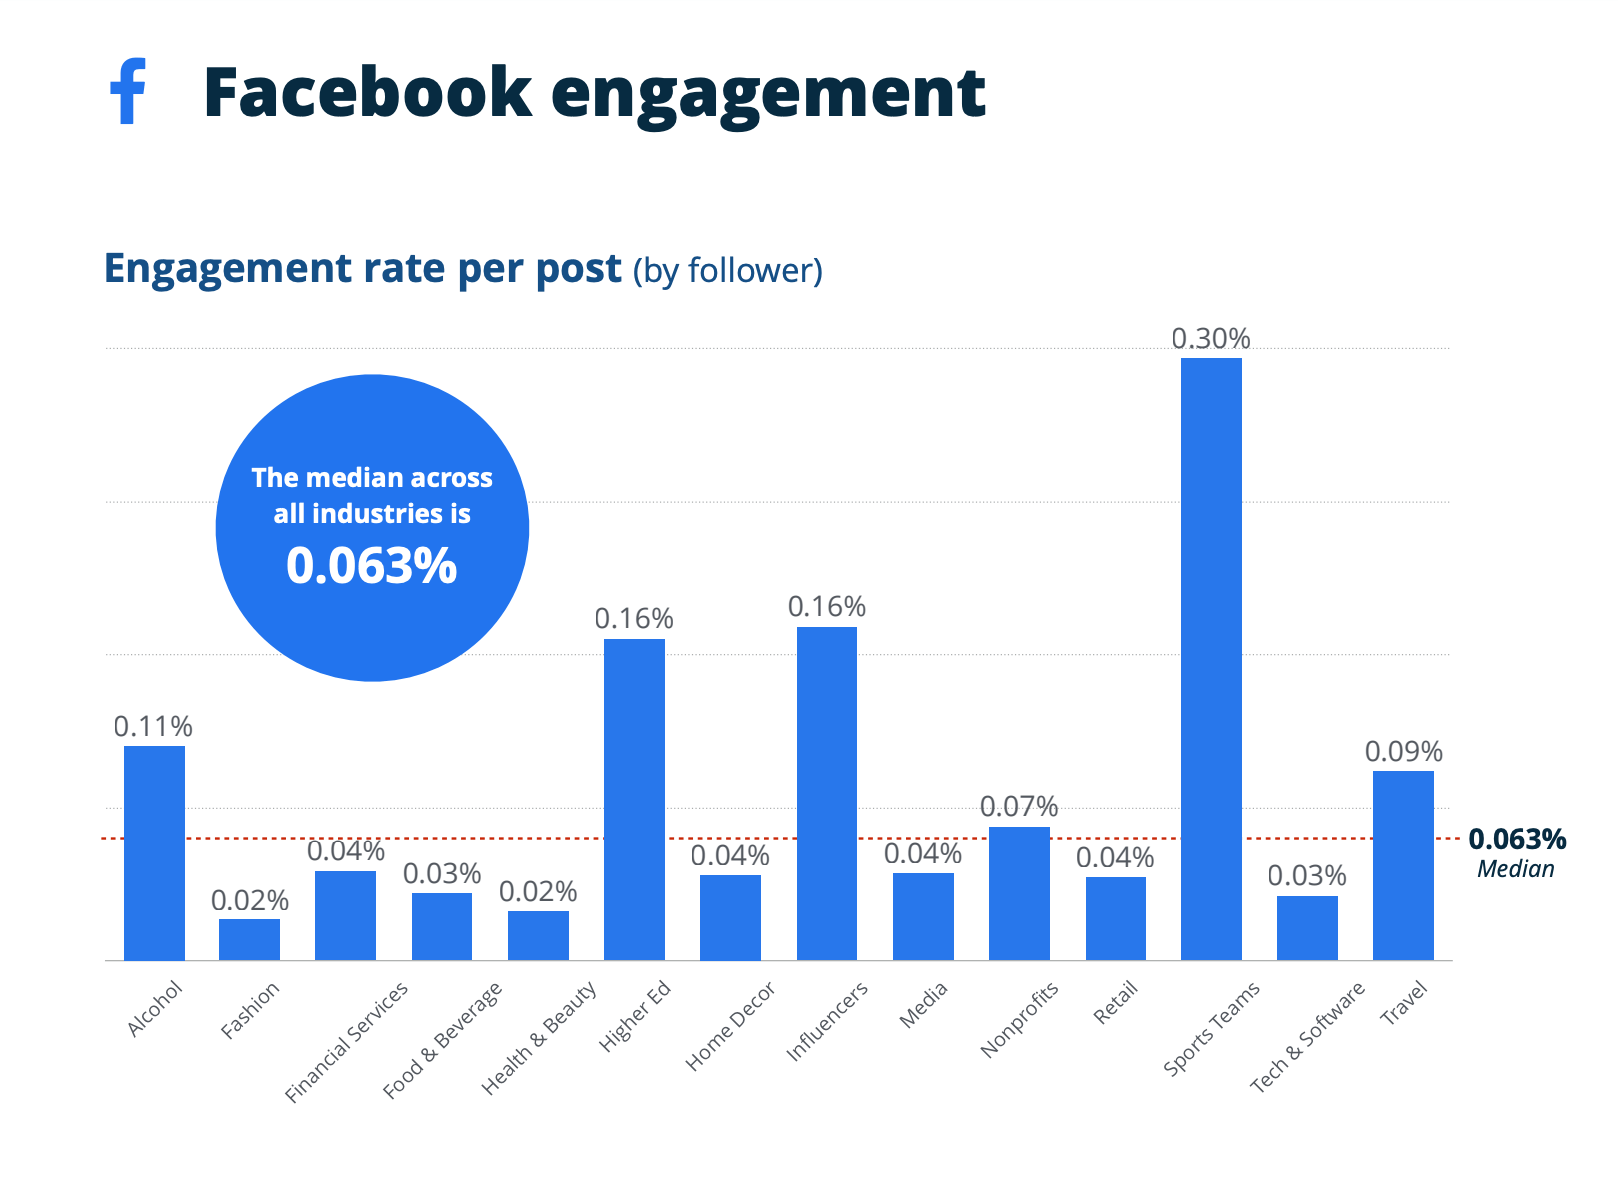
Takeaway: Since the posting frequency isn’t correlated to the engagement rate, it’s clear increasing your Facebook engagement is more about doubling down on quality than quantity. If your target audience is on Facebook, don’t spam them with a large number of posts. Instead, try to post more of the content they like and build a community via Facebook Groups.
Social media benchmarks for Instagram
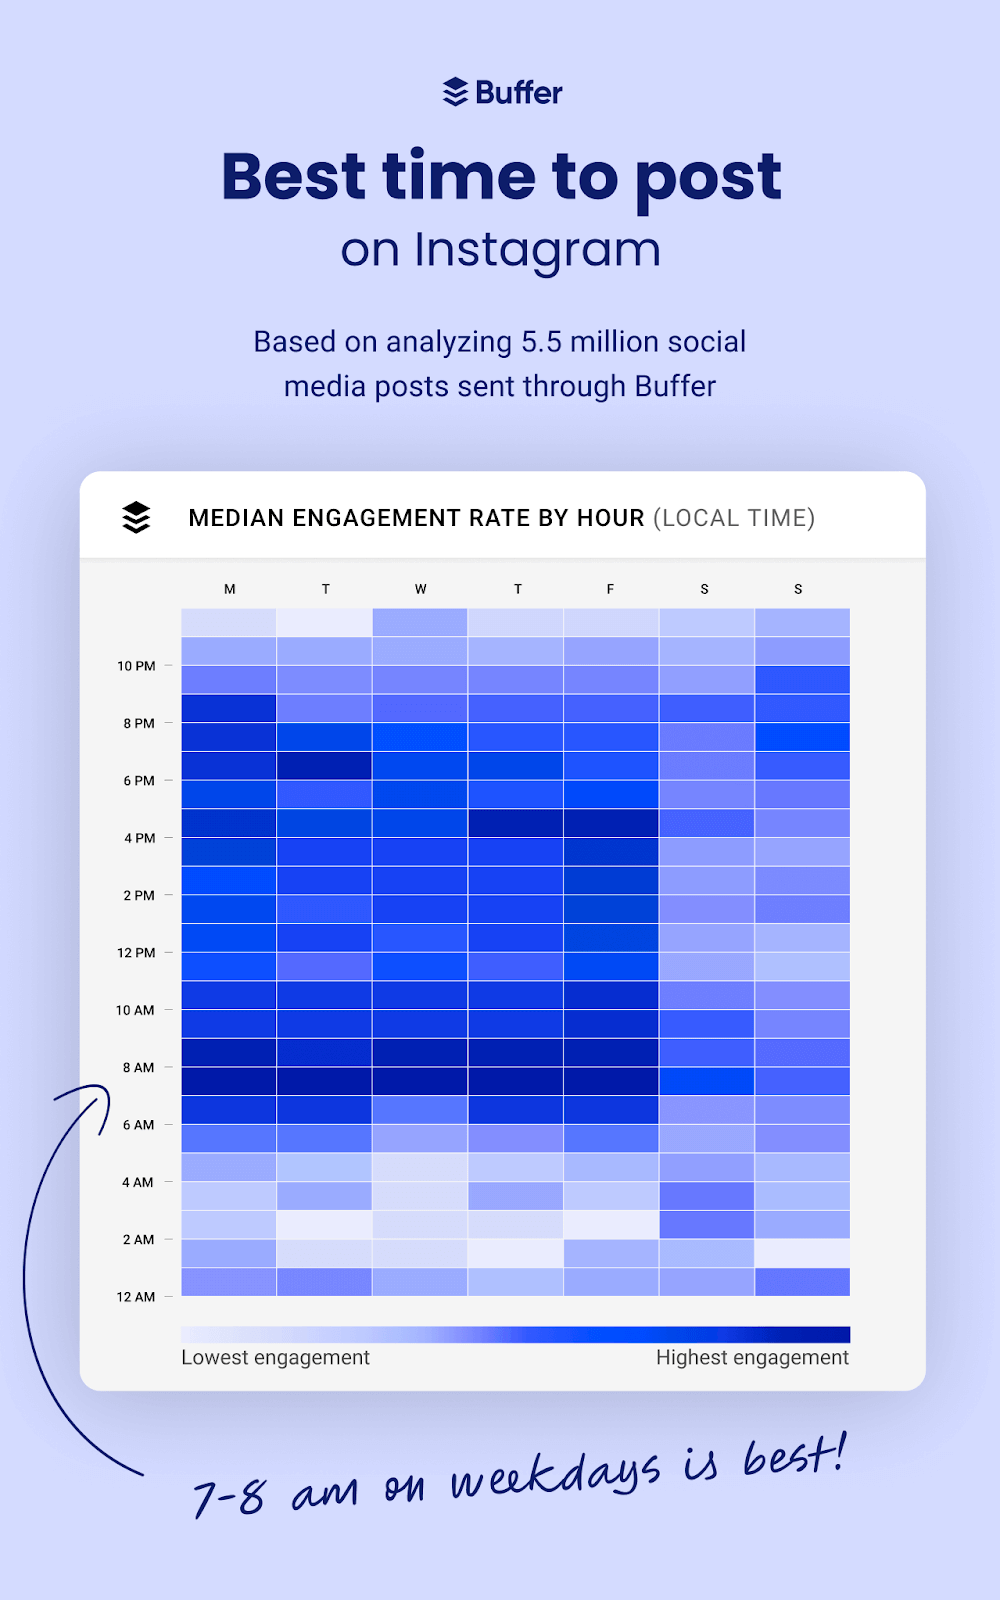
Buffer’s analysis found the best time to post on Instagram is 7–8 AM on weekdays.
And another one of Buffer’s research of over 12 million (!) Instagram posts found the best type of content format is Instagram Reels.
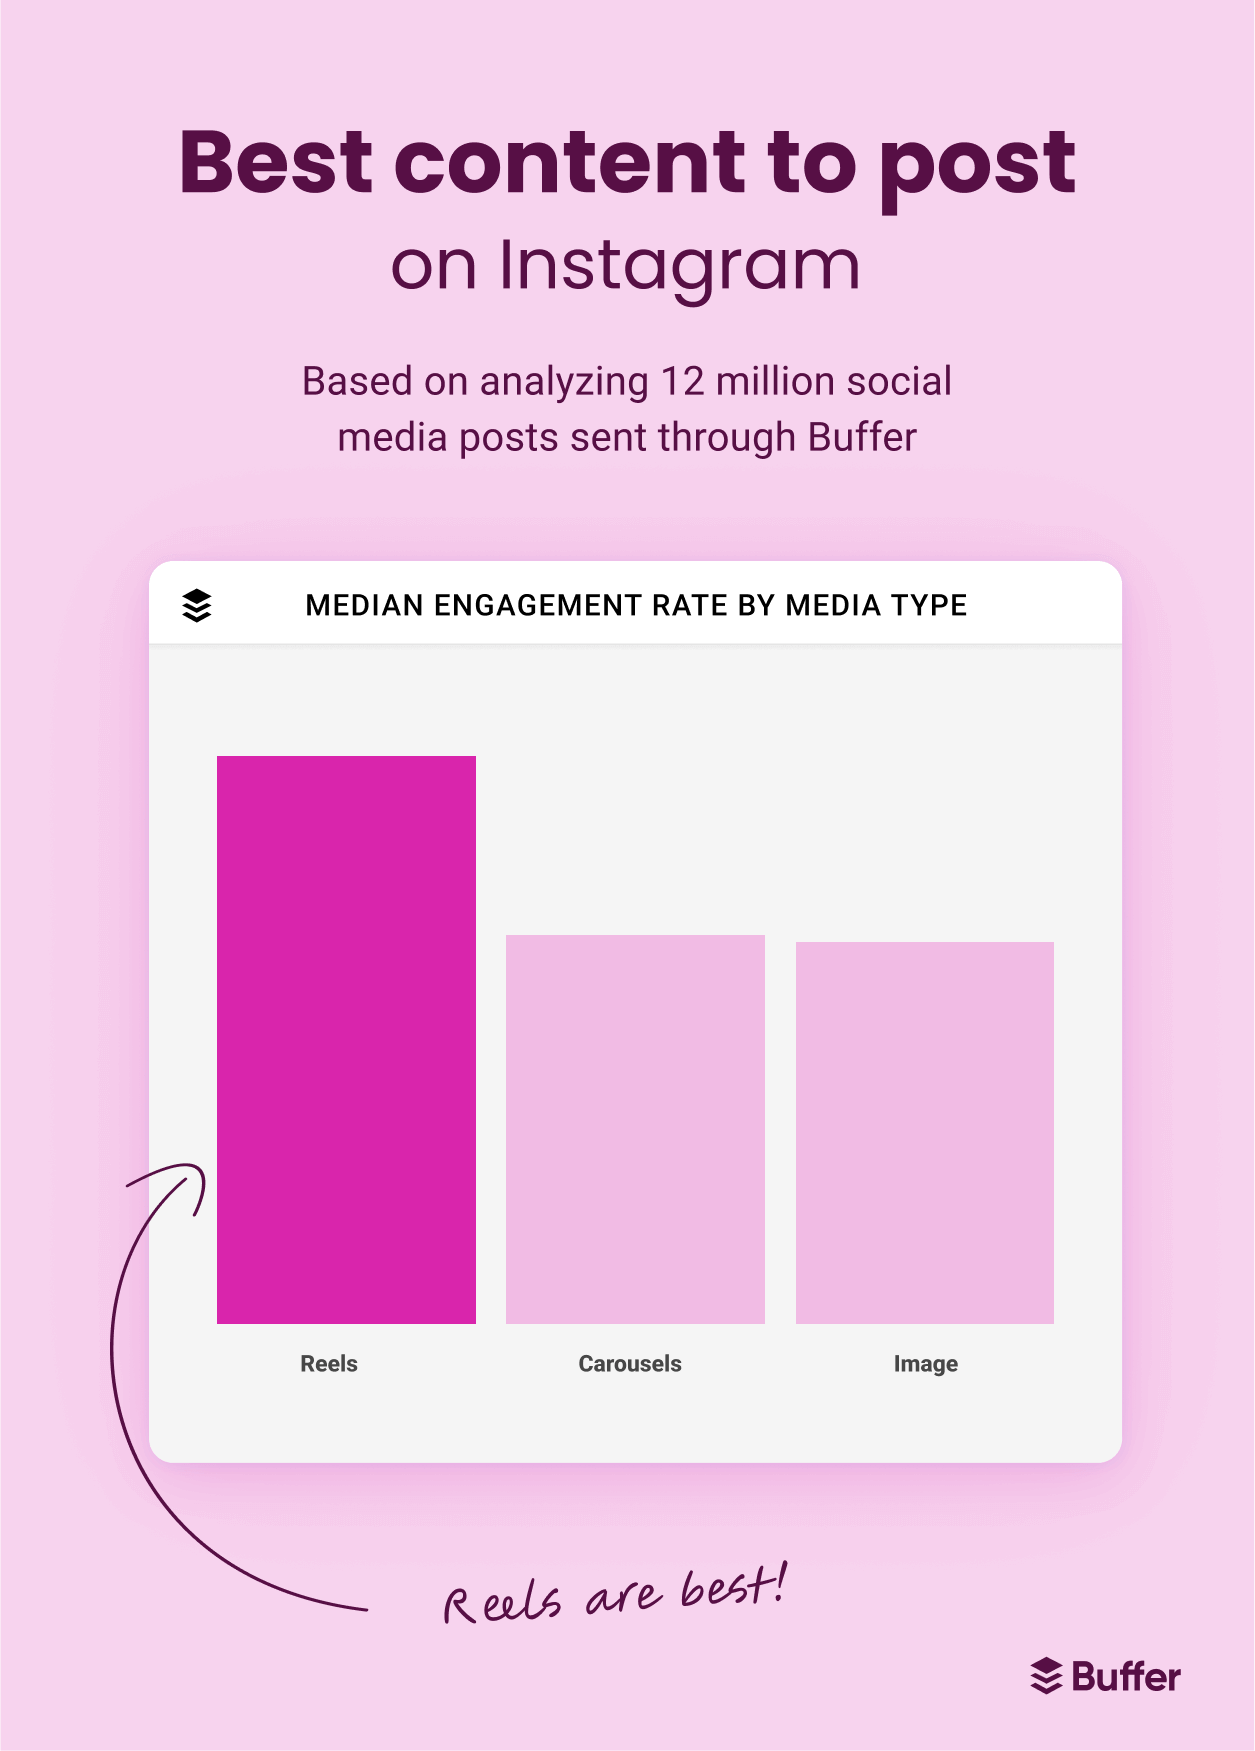
While videos are certainly Instagram algorithm’s favorite, carousel posts and single-image feeds nearly get the same engagement.
In general, RivalIQ’s report found brands are getting a 0.43 percent engagement rate on Instagram. Higher education brands get the most engagement, followed by sports companies and influencers.
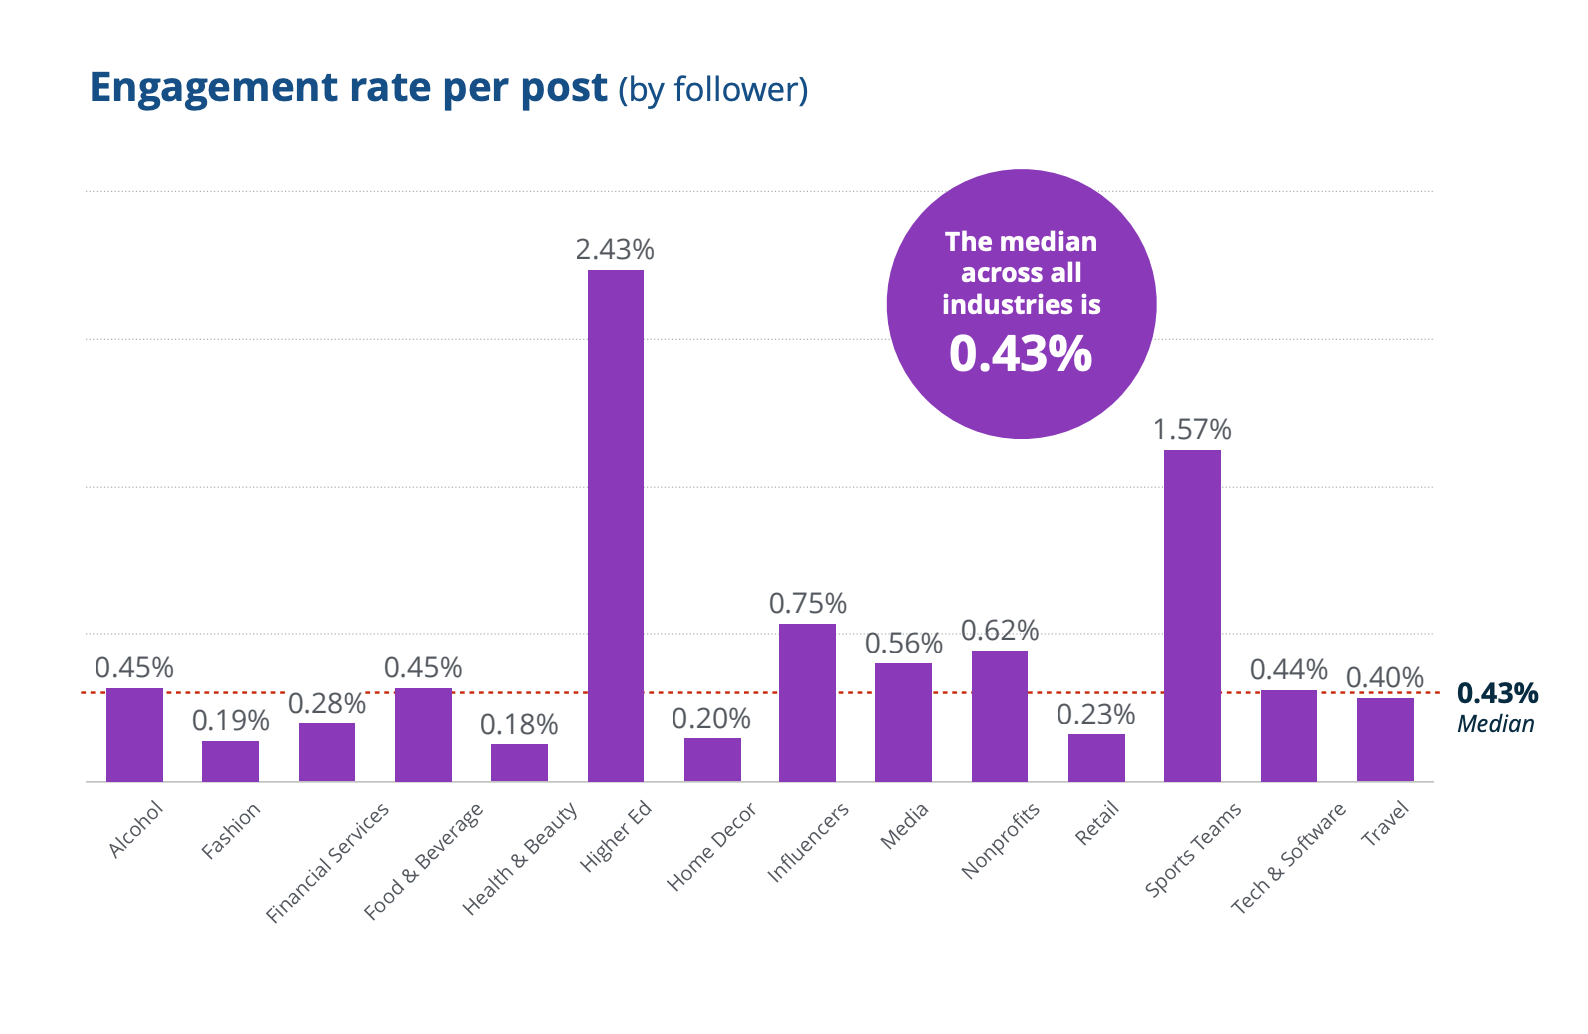
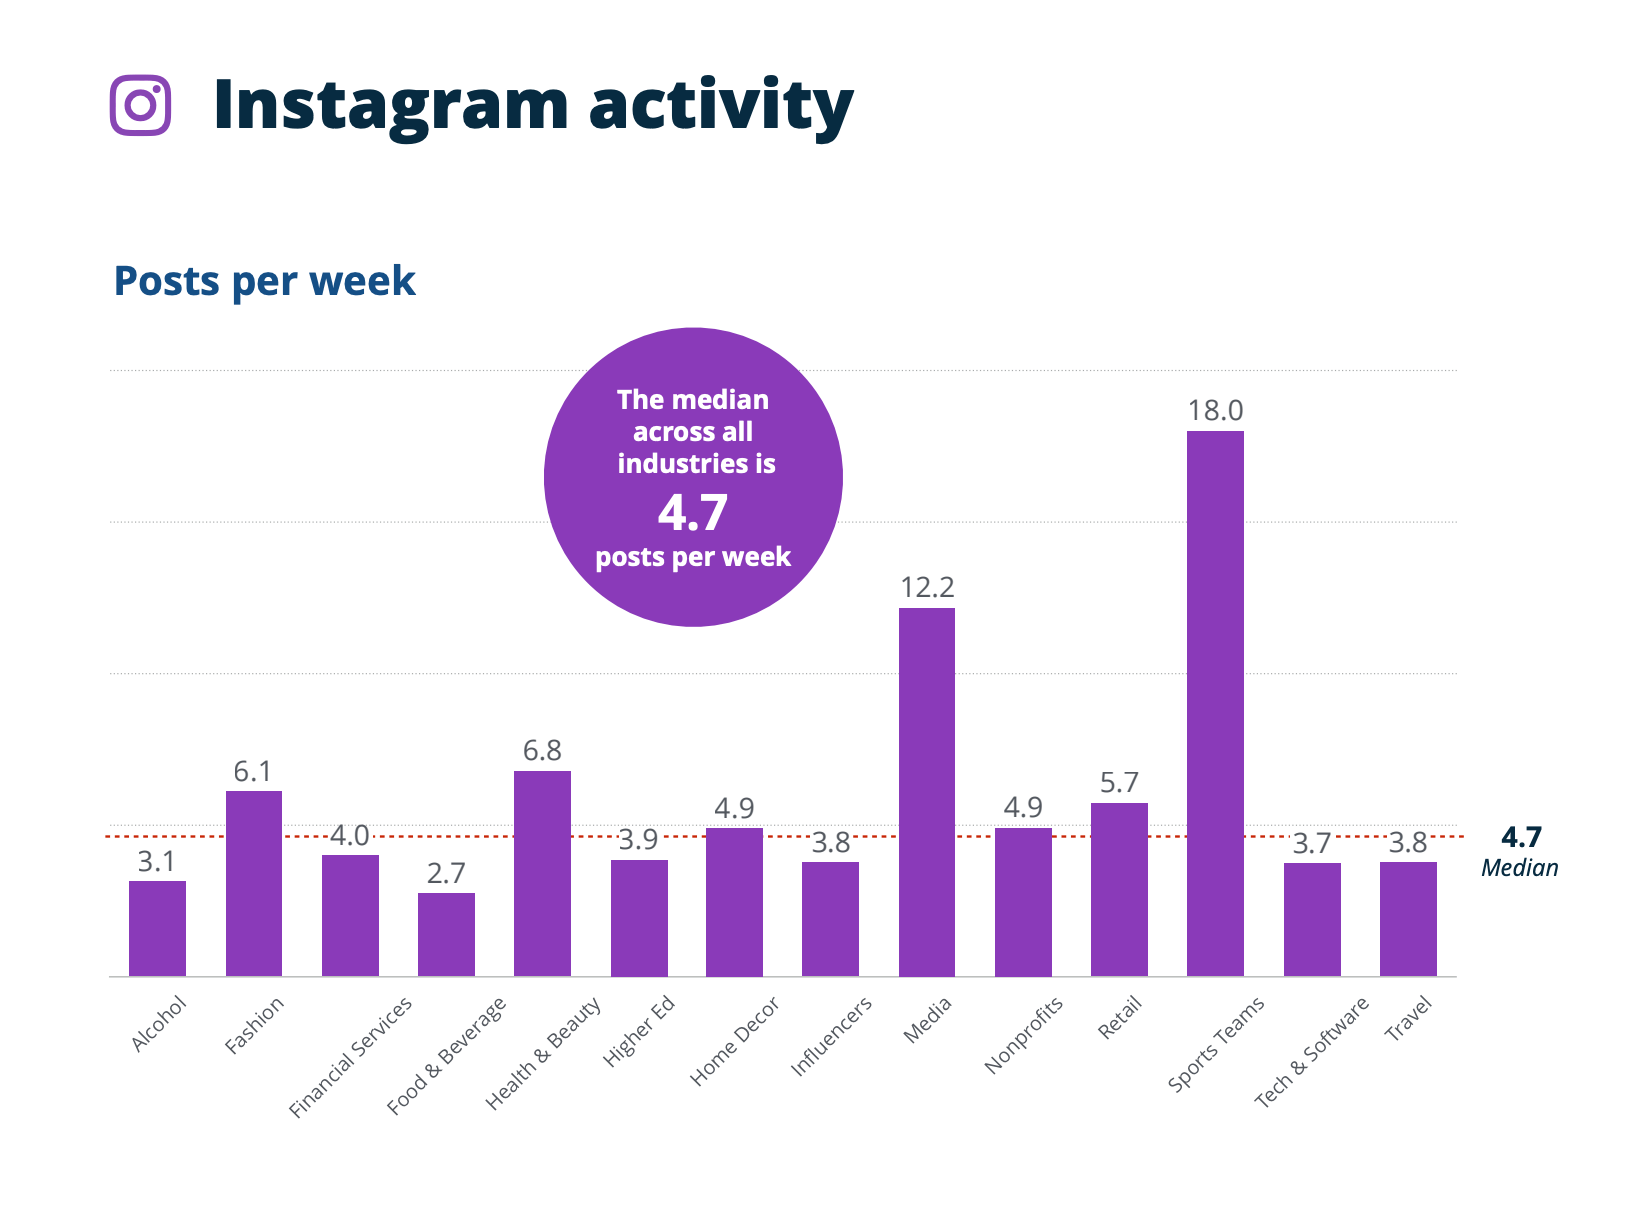
To get this engagement, brands are posting 4.7 times a week, according to RivalIQ. Here, the number of posts is somewhat correlated to the engagement rate. Sports teams post the most often (18 times weekly). The posting frequency doesn’t lead to high engagement rates in other industries.
Takeaway: Educational content via video gets the most engagement on Instagram. Create Instagram Reels ideas centering informational and tutorial content to help your audience solve a pain point.
Social media benchmarks for TikTok
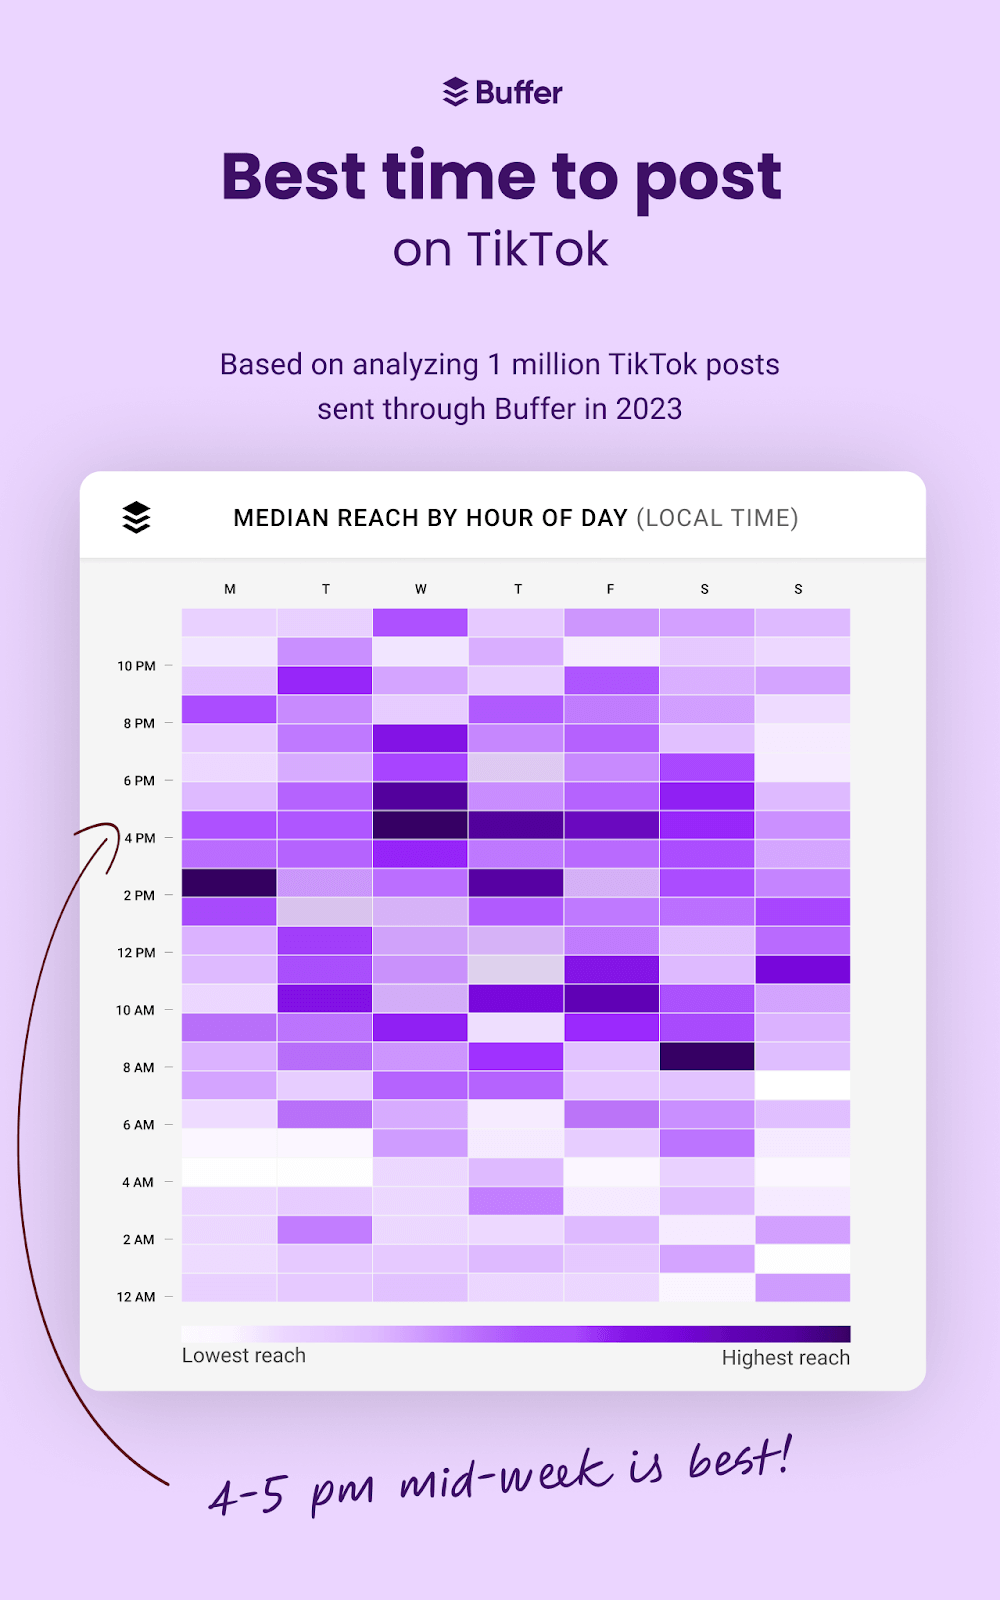
Buffer found the best time to post on TikTok is mid-week between 4–5 PM.
You can post slideshows and static images on TikTok along with videos. But there haven’t been many research studies examining which types of posts perform best on the platform. A small experiment by Emily Hessney Lynch found that videos still outperformed slideshows. So, the best way to increase your TikTok followers is to double down on video content.
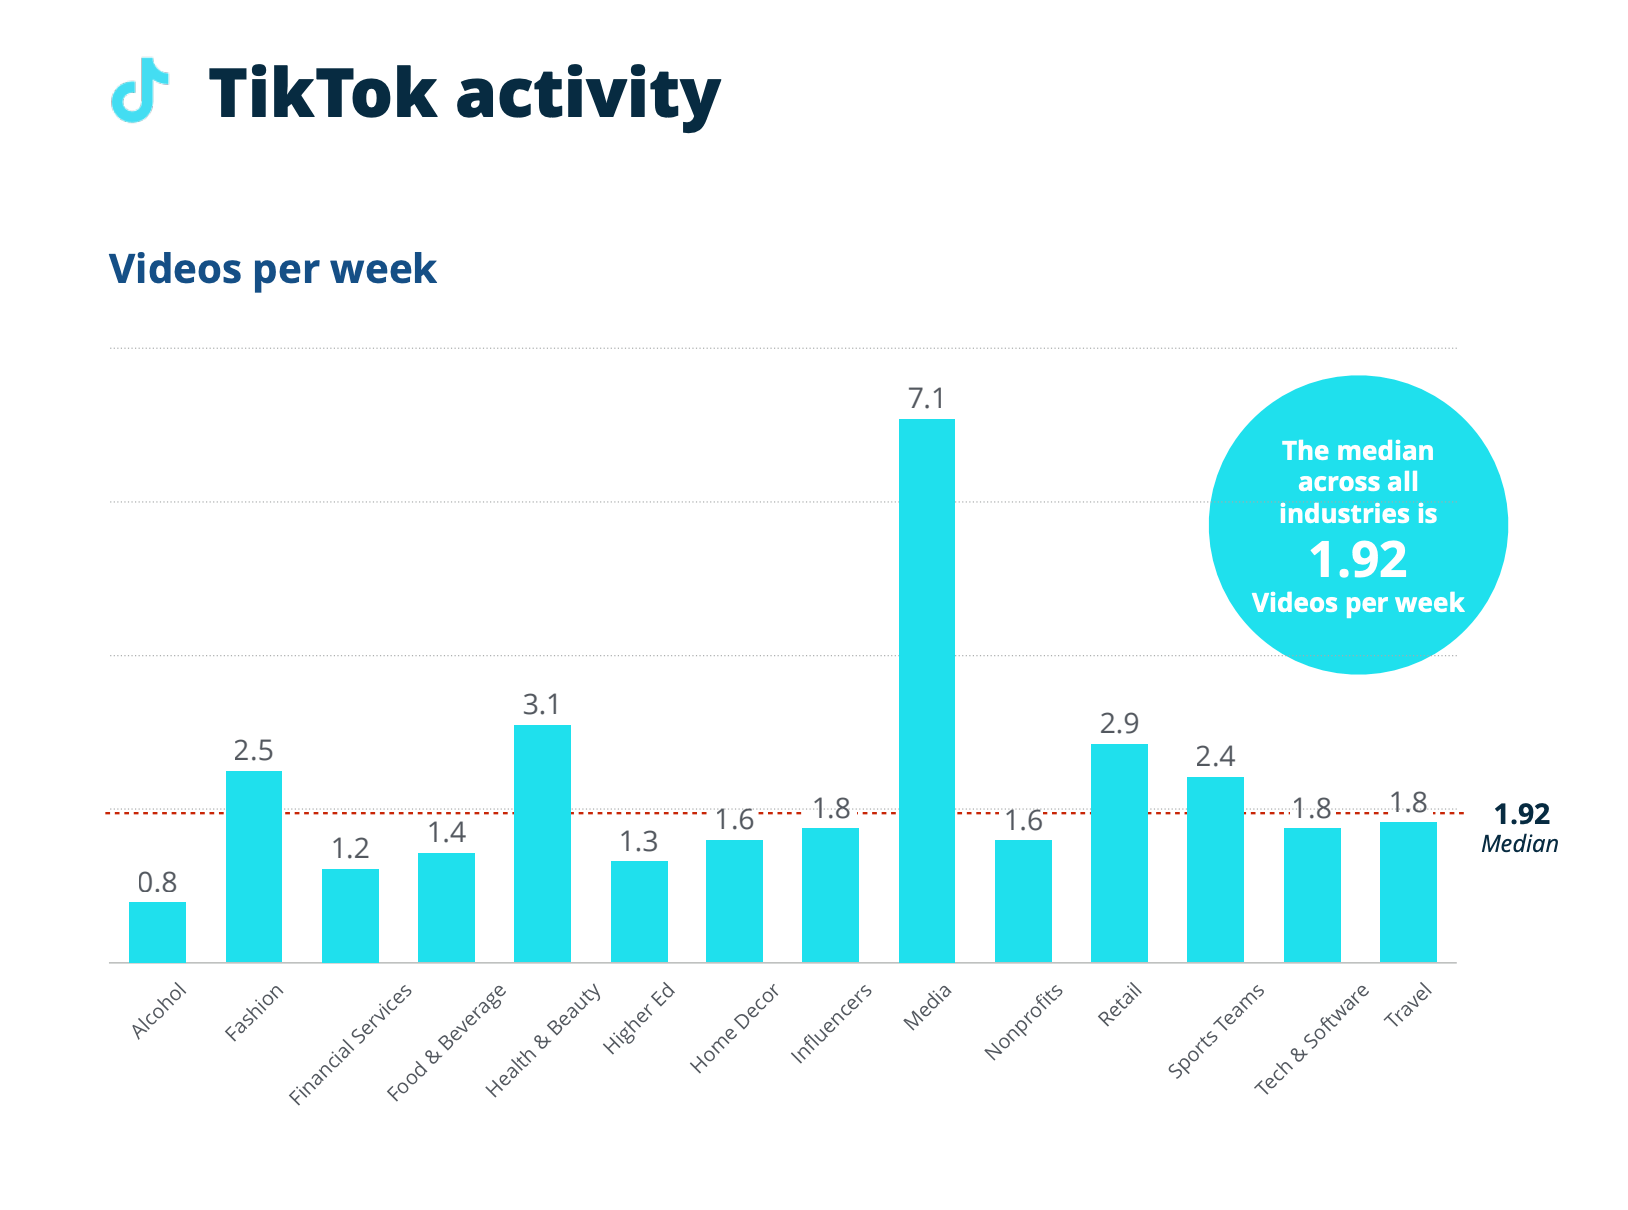
Media industry posts the most on TikTok (7.1 times weekly), according to RivalIQ. The median posting frequency for TikTok is 1.92 videos per week.
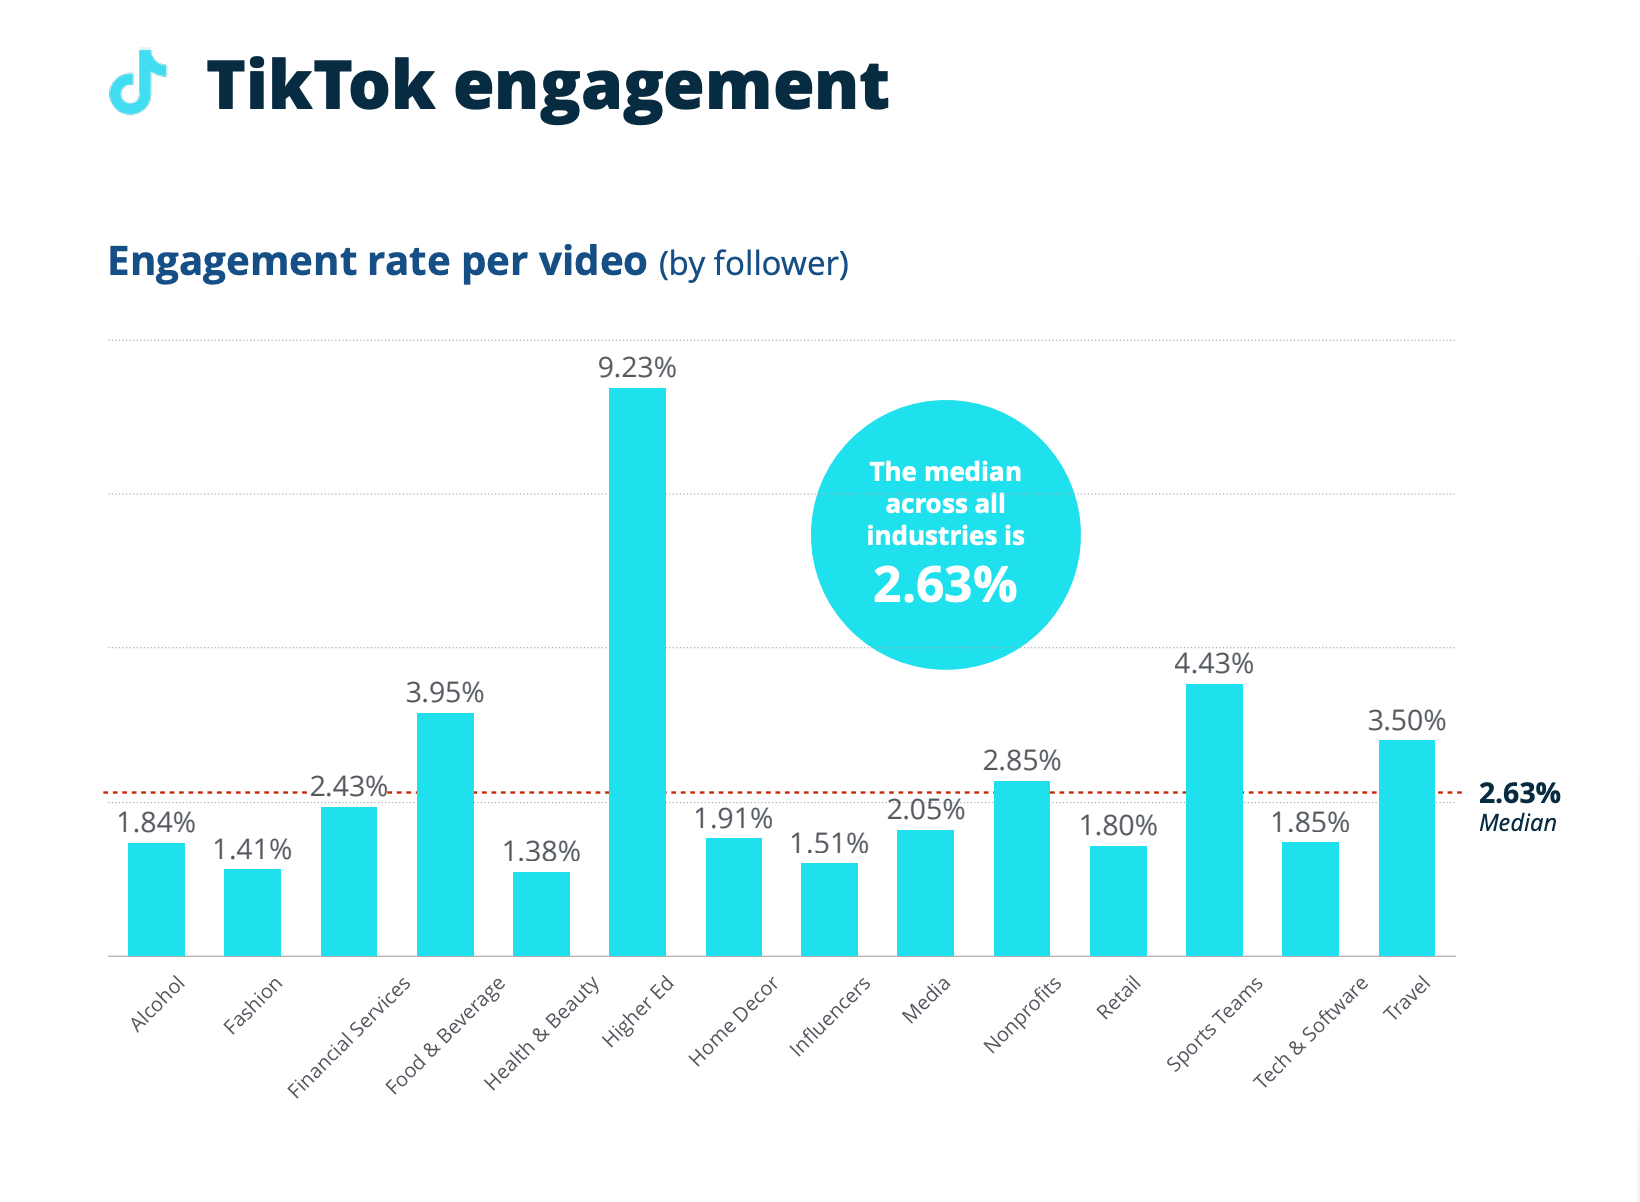
The engagement rate is the highest for TikTok at 2.63 percent. Higher education takes the cake here, too — with a 9.23 percent engagement rate. Sports, food & beverage, and the travel industry also shine on TikTok.
Takeaway: TikTok has one of the highest engagement rates in all industries. Try achieving a consistent posting schedule on this platform to get the most bang for your buck. Two videos a day are more than enough.
Social media benchmarks for Twitter (now X)
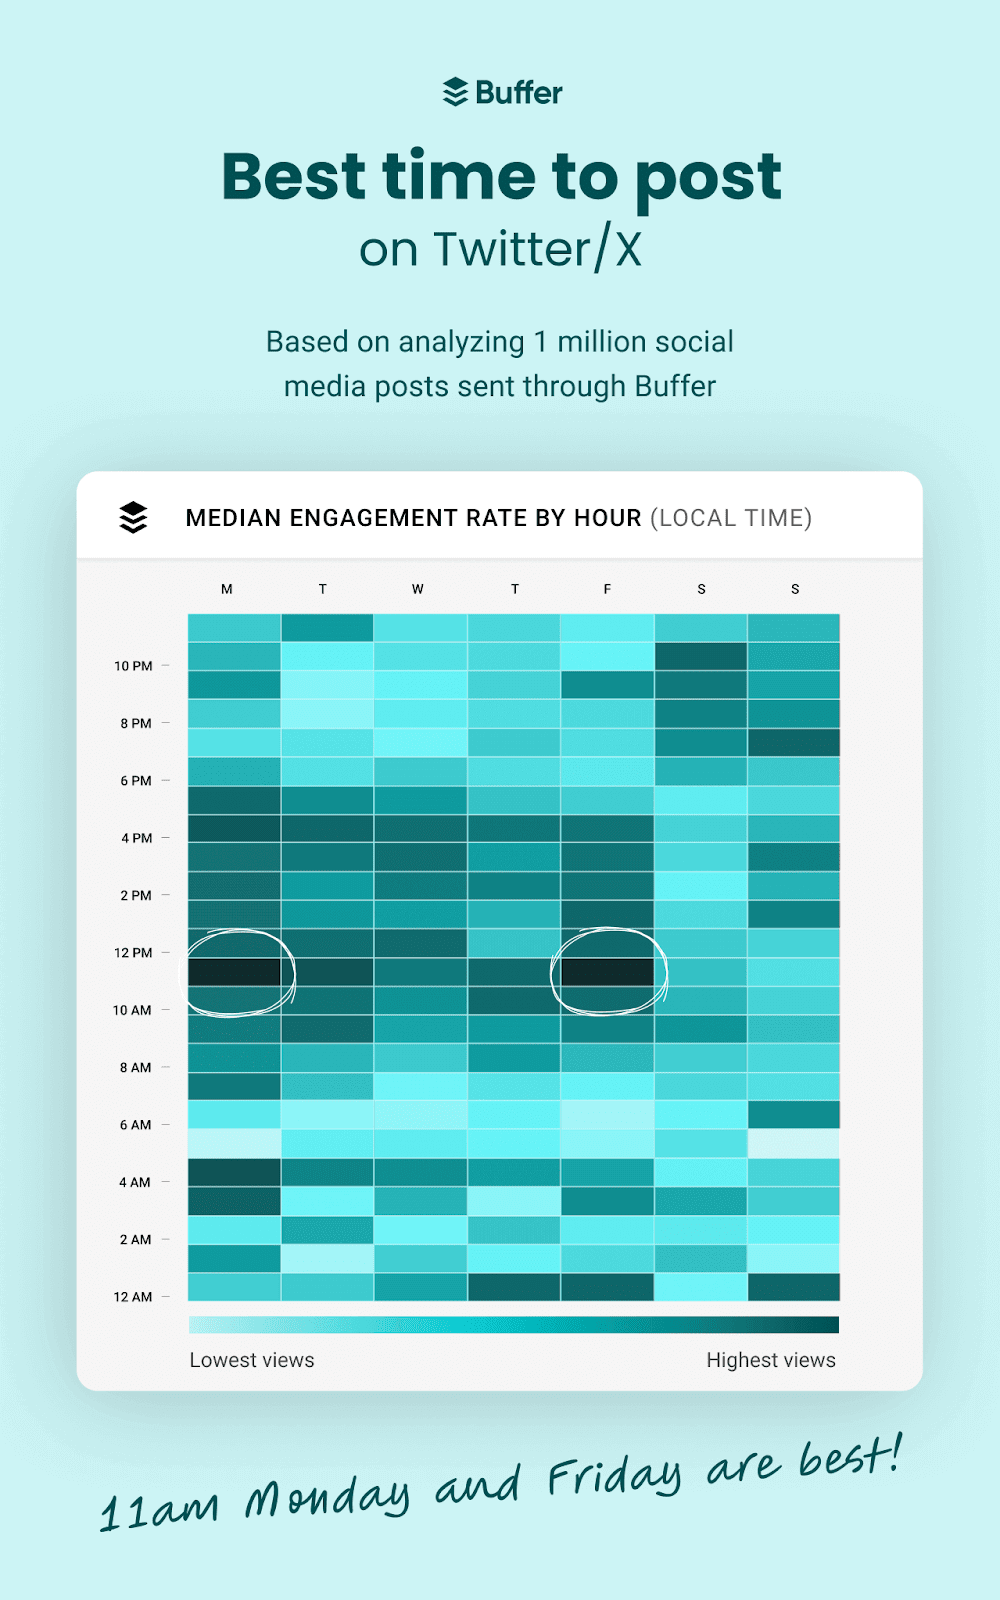
An analysis of a million posts by Buffer found the best time to post on Twitter (now X) is 11 AM on Mondays and Fridays.
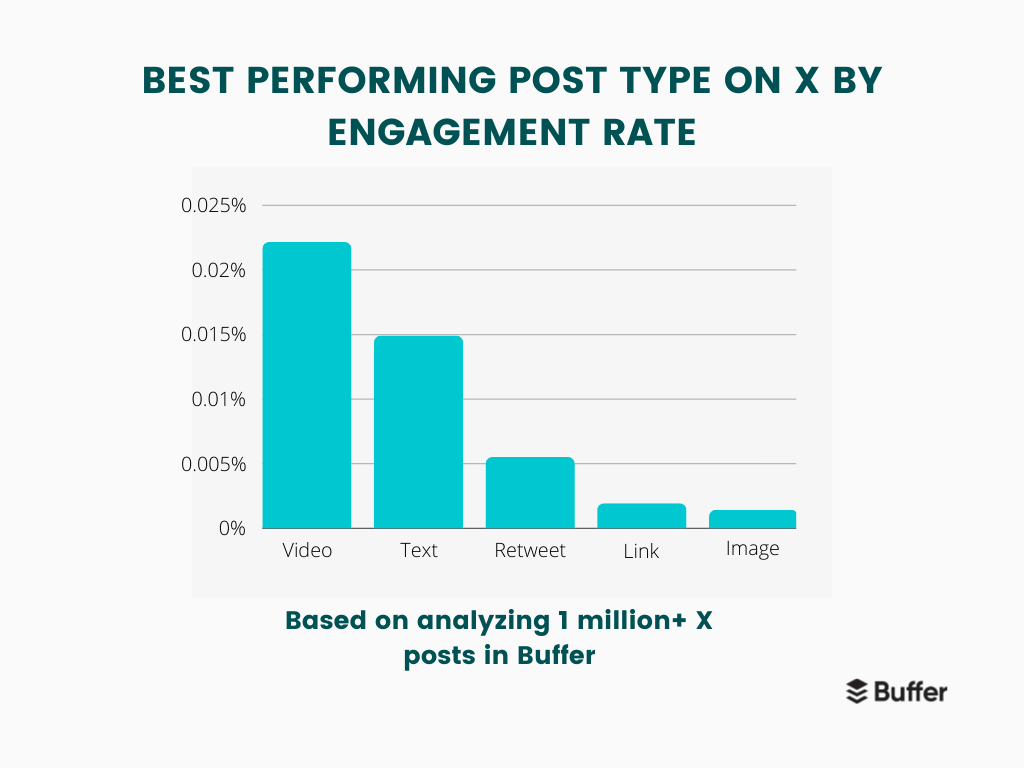
Buffer also found that the X algorithm prioritizes video — since they get the most engagement on the platform.
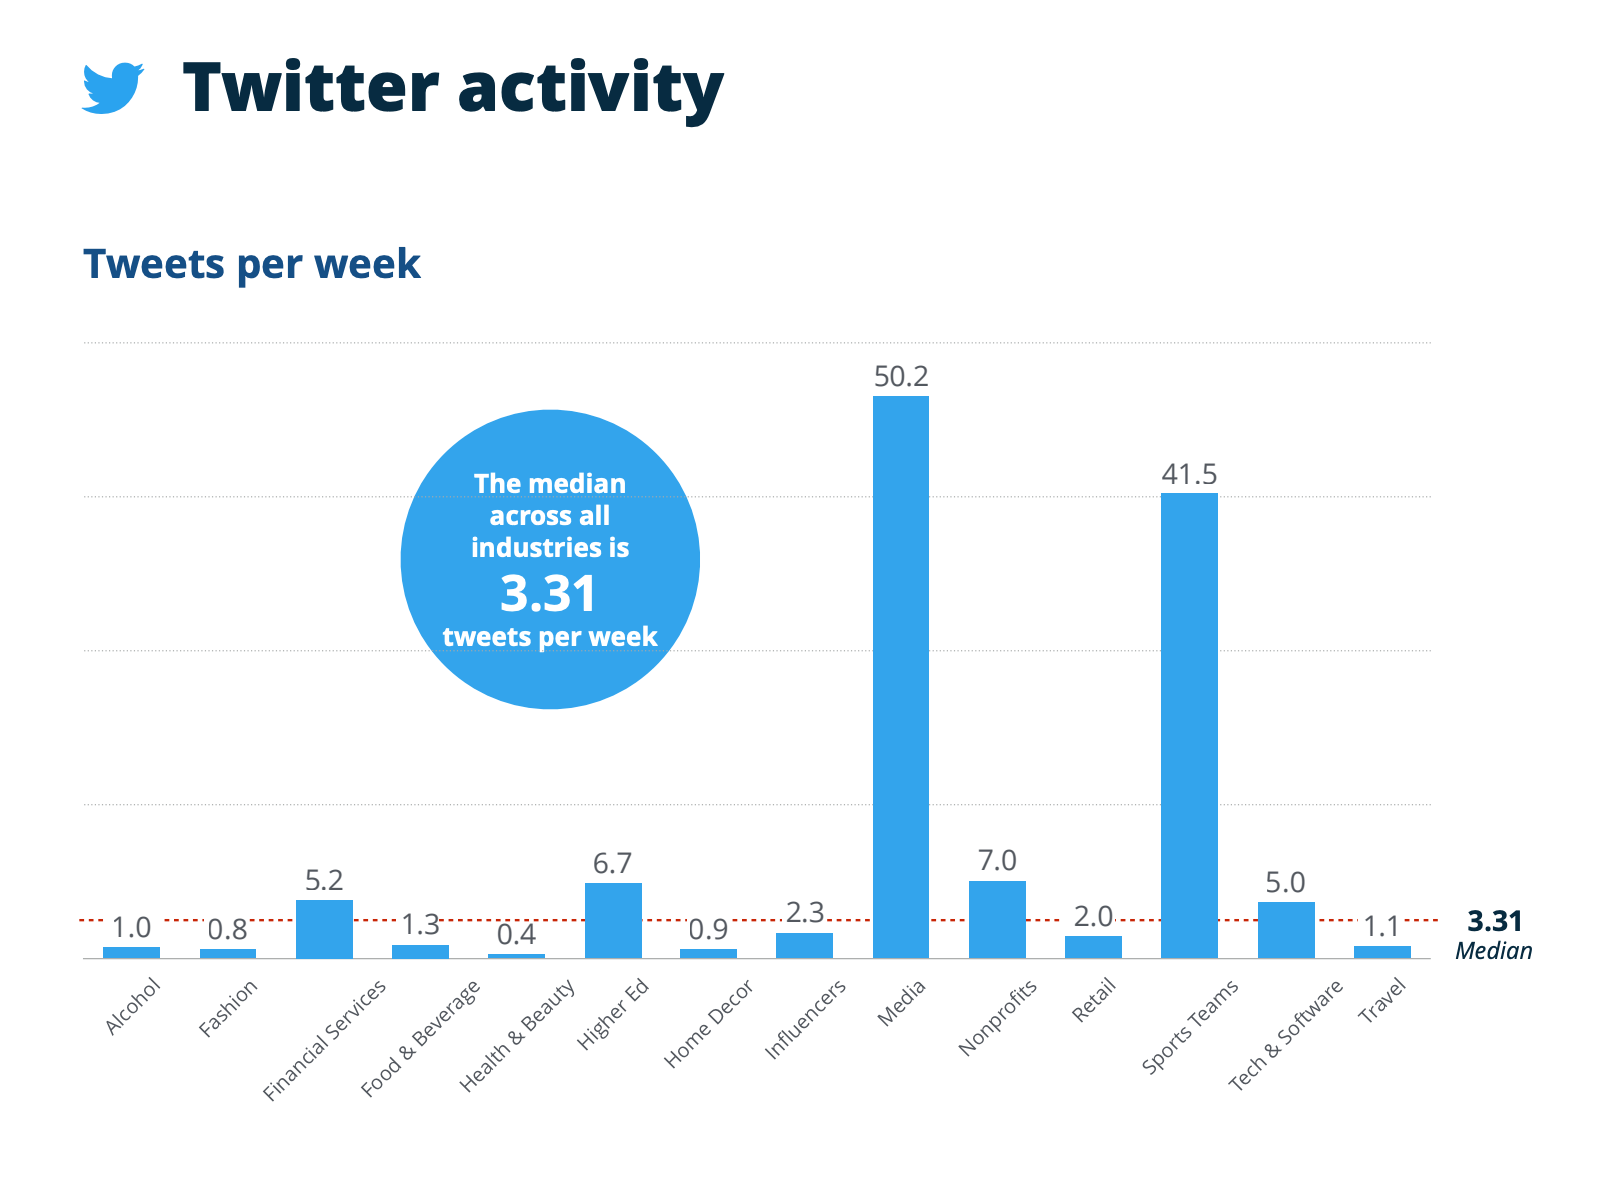
Brands are posting 3.31 tweets per week on X, says RivalIQ’s analysis. Media takes the lead here (by a lot!), followed by sports and nonprofits.
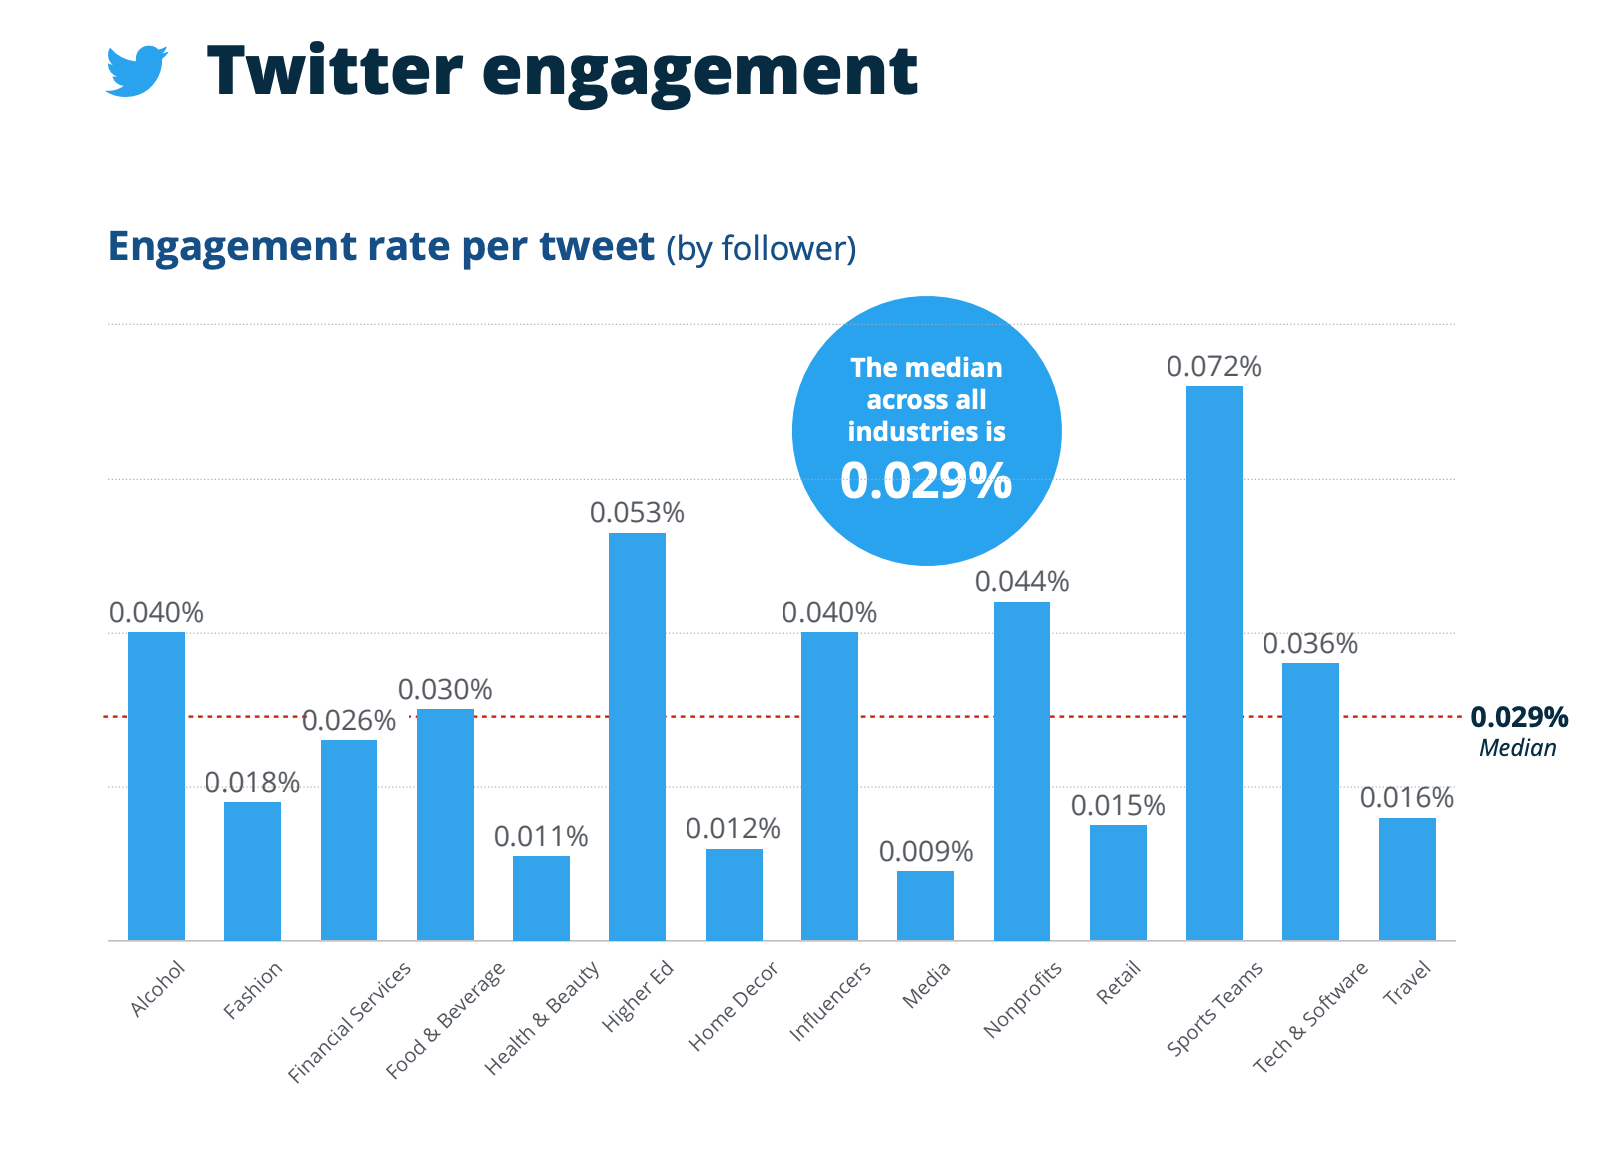
The engagement rate on X (according to RivalIQ) is a median of 0.029 percent. Sports teams get the most engagement, followed by higher education and nonprofits.
Takeaway: Twitter (now X) is starting to prefer video content. If you’re already creating videos for TikTok or Instagram, repurpose them for X. This platform doesn’t boast a very high engagement rate, but posting more might help you improve your performance.
Social media benchmarks for LinkedIn
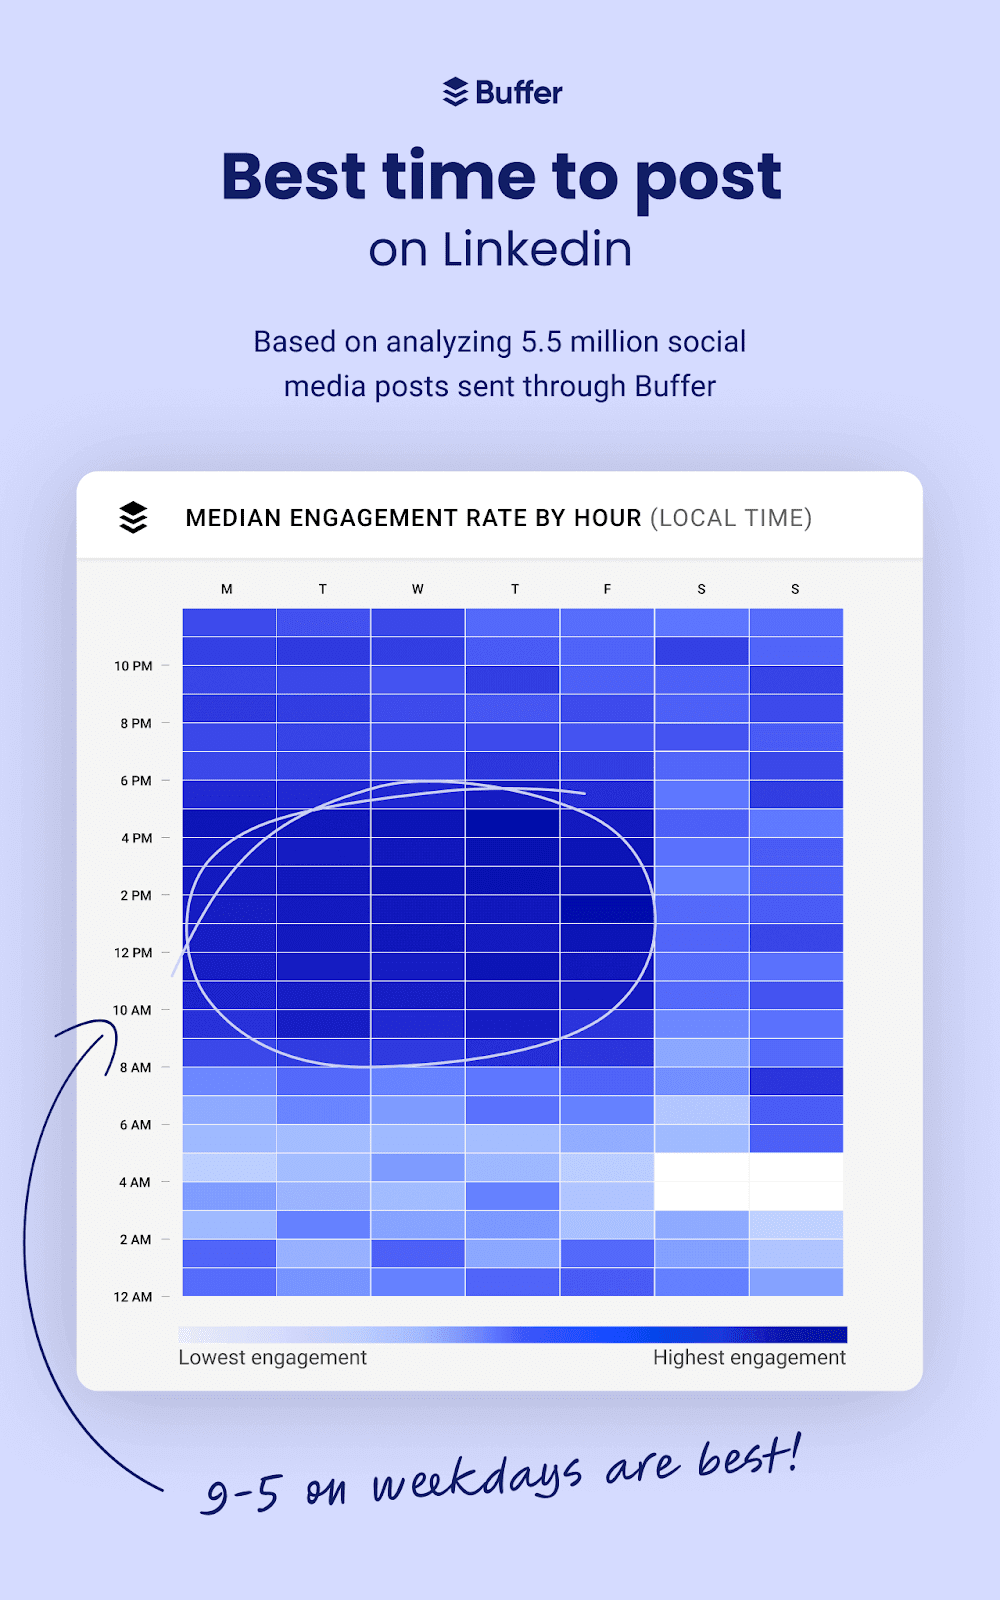
It shouldn’t come as a surprise that the best time to post on LinkedIn is during working hours. Buffer’s analysis of 5.5 million posts found posts that go live between 9–5 on weekdays perform the best.
And the lovable personal-branding platform is no different from other social networks in favoring videos. Buffer’s research found they get the most engagement.
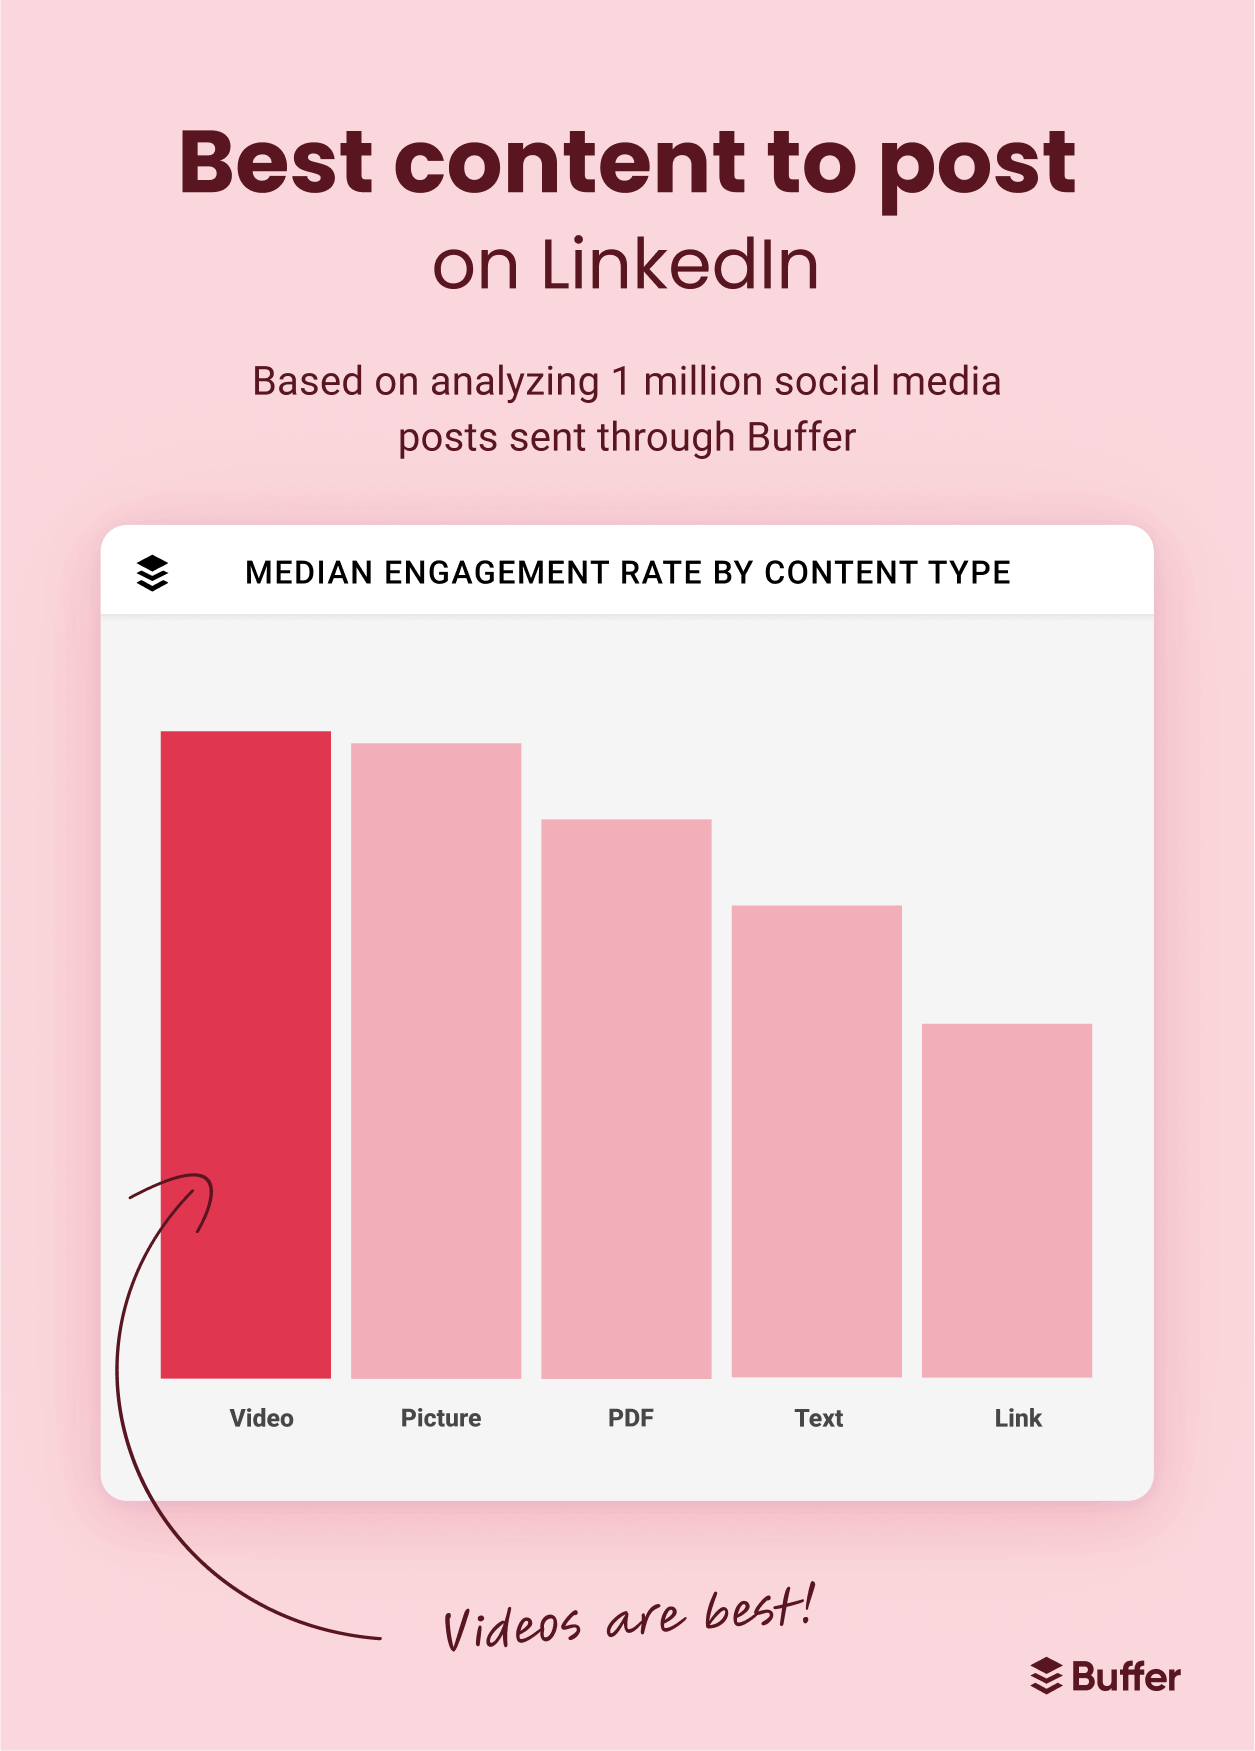
However, the difference wasn’t huge — picture posts and LinkedIn carousels nearly get the same engagement as video posts on LinkedIn.
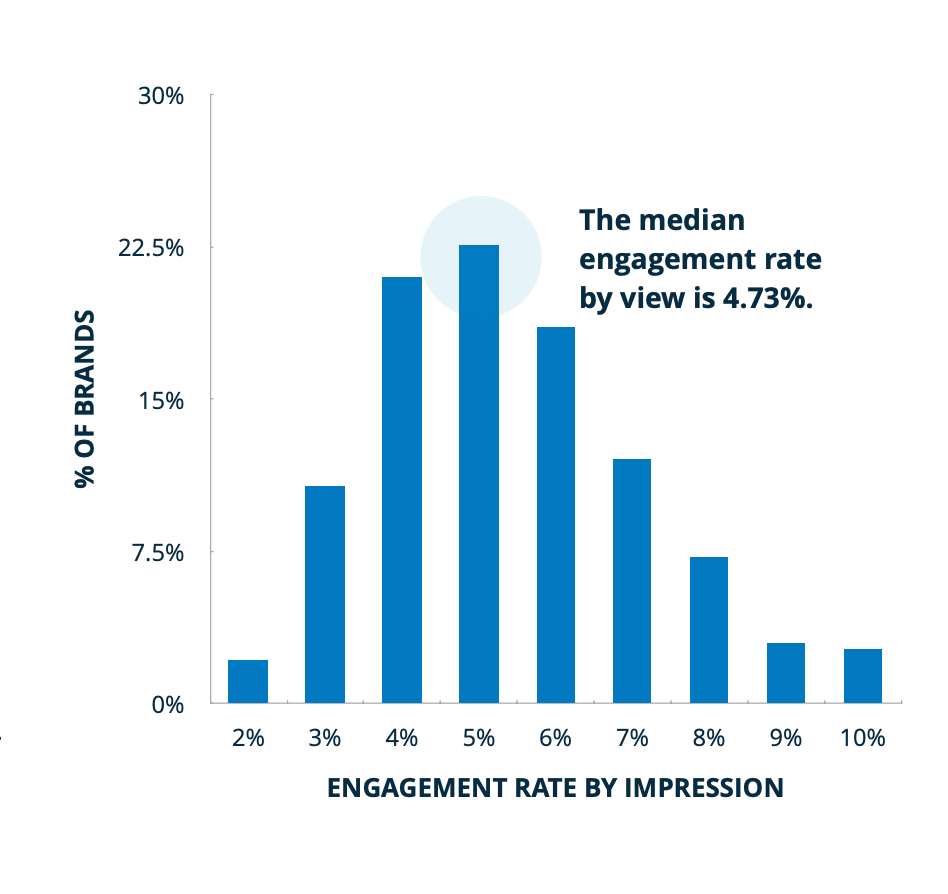
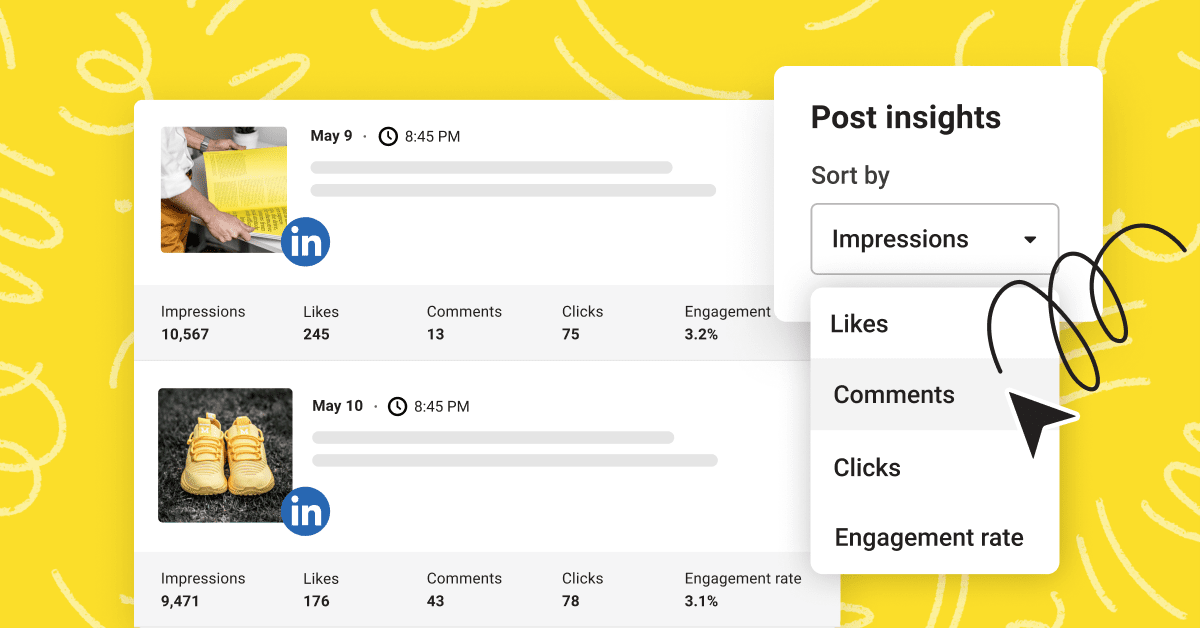
RivalIQ published a separate 2024 LinkedIn benchmark report analyzing 372 handles and 58,000 posts. It found the average engagement rate among brands was 4.73 percent.
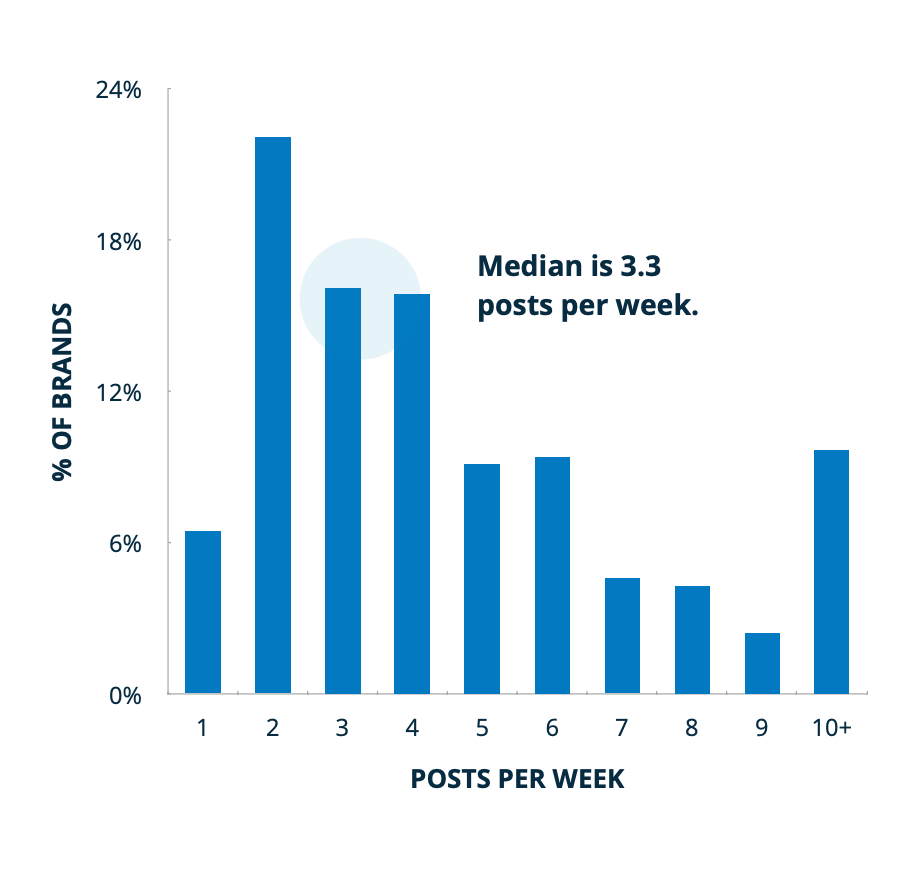
To achieve this engagement rate, companies were posting 3.3 times a week.
Unfortunately, RivalIQ didn’t provide an industry-level breakdown of how many times each industry posts on LinkedIn and what engagement rate various niches are witnessing.
Takeaway: Like Facebook, LinkedIn loves quality more than quantity. And while video gets the most engagement, it’s a close fight with other forms of posts. The best strategy would be to have a healthy mix of content formats and see which gets you the most engagement.
How to use social media industry benchmarks to your benefit
You knew your social media performance. And now you know industry-specific benchmarks. How can you use the numbers I shared above to inform your marketing strategy? Here are three ways:
1: Use social media benchmarks to set goals
Your social media success isn’t entirely dependent on hard work. Social media benchmarks help you understand where you’re actually falling short. For example, you might’ve had a goal to get 2 percent engagement rate on TikTok as a healthcare brand, but then you learned that your industry’s median engagement rate is 1.38 percent.
Understanding the industry standard can stop you from putting undue pressure on yourself and risking creator burnout. Use social media benchmarks to guide your KPIs and make them more realistic.
2: Use social media benchmarks for reporting the true picture
A 0.026 percent engagement rate on Twitter (now X) in financial services might seem bleak to your stakeholders. Will that lead to a good growth rate? Should you practice more retweets or increase the number of posts?
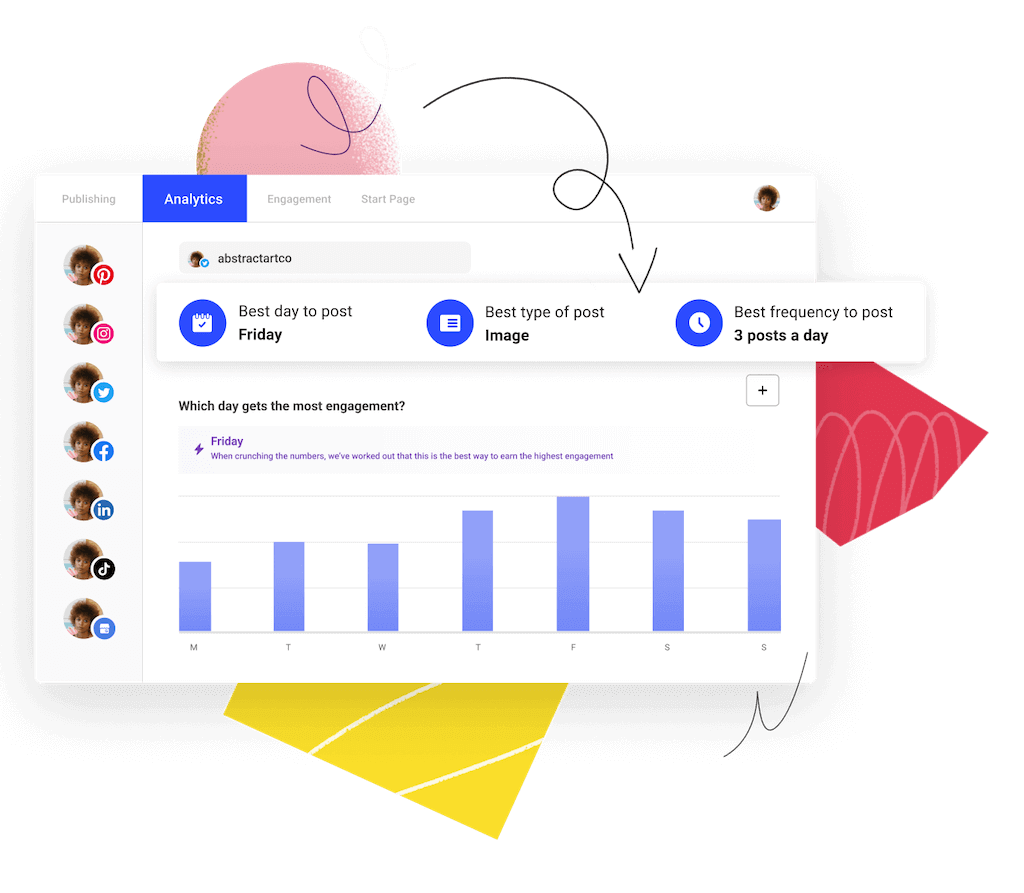
But presenting that number alongside benchmark data can help your bosses see the whole picture. Even better: You can supplement the benchmark metrics with your own social media analytics. Using social media analytics tools like Buffer, you can present a wholesome social media report detailing your best time to post vs. the industry’s best time to post, your top-performing posts’ content formats vs. industry-specific standards, etc.
This way, your stakeholders get a wholesome picture of your social media campaigns and understand the “why” behind your content strategy.
The best part? Buffer is an all-in-one social media management tool that’ll not just help you with detailed social media performance analytics, but also post scheduling, managing multiple accounts under one roof, and responding to comments without ever leaving the tab. Sign up for free today.
3: Use social media benchmarks as an aspirational vision board
If your social media metrics look off the charts currently, let benchmark data serve as an inspiration. The good thing is numbers aren’t vague — you can specifically pinpoint where your scope of improvement lies and work upward toward your weaknesses.
But remember: Even benchmark data points keep shifting under the whims of algorithms, competition, and other factors out of your control. And what one study calls ‘benchmarks’ depends on its own methodology and sample size — it can differ vastly from one research report to another. Take every benchmark with a grain of salt and use it in conjunction with your past performance metrics and audience feedback.
Try Buffer for free
140,000+ small businesses like yours use Buffer to build their brand on social media every month
Get started nowRelated Articles

A guide to the content marketing metrics that will help you measure success, plus guidance from top content marketing leaders.
In this guide, we’ll go through everything you need to know about TikTok analytics — from what metrics and insights are available to how to get all of them for free to what you can do with them to boost your growth on TikTok.
You can now analyze and report your results on LinkedIn, on top of Facebook, Instagram, and Twitter. This makes Buffer's analytics an all-in-one solution for these four popular social networks for businesses.