
61 Key Social Media Metrics, Defined


Former Director of People @ Buffer
Of all the hundreds of social media acronyms and abbreviations out there, I think “KPI” has confounded me the most.
I think it’s because the phrase “key performance indicator” always sounds like something you need to be wearing a suit in front of a Powerpoint presentation in order to say.
But when you get down to it, it’s really quite simple. KPI is just a way of saying “This is the stuff that’s important enough to me to focus on and measure.”
Basically, social media KPIs, or social media metrics, are whatever is most important for your business. These are the goals and benchmarks that help you determine how well your campaigns and strategies are performing.
Social media KPIs could be the amount of engagement or shares you’re receiving on your social media networks. You could also track clicks back to your website via social media, or conversions once visitors get there.
In fact, there are so many different KPIs that it can be tough to keep them straight sometimes. In this post, we’ll look at a variety of social media metrics you might choose to focus on, with a brief explanation of each and how to measure it.
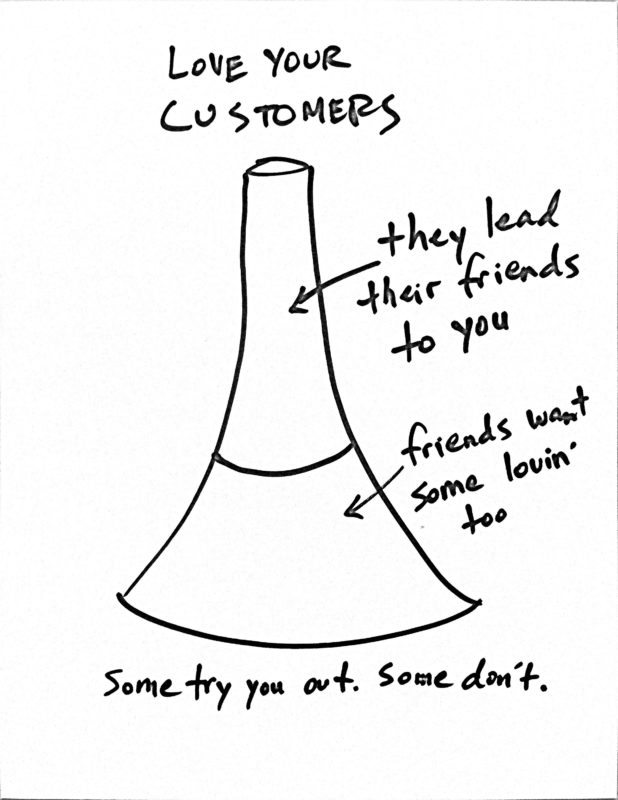
First, a quick view of the social media funnel
Funnels probably deserve a post of their own, but for our purposes here it might help to keep an image in our eye of what a typical customer journey with a brand or product looks like (or one version of it, anyway), courtesy of a great visual from Intersection Consulting.
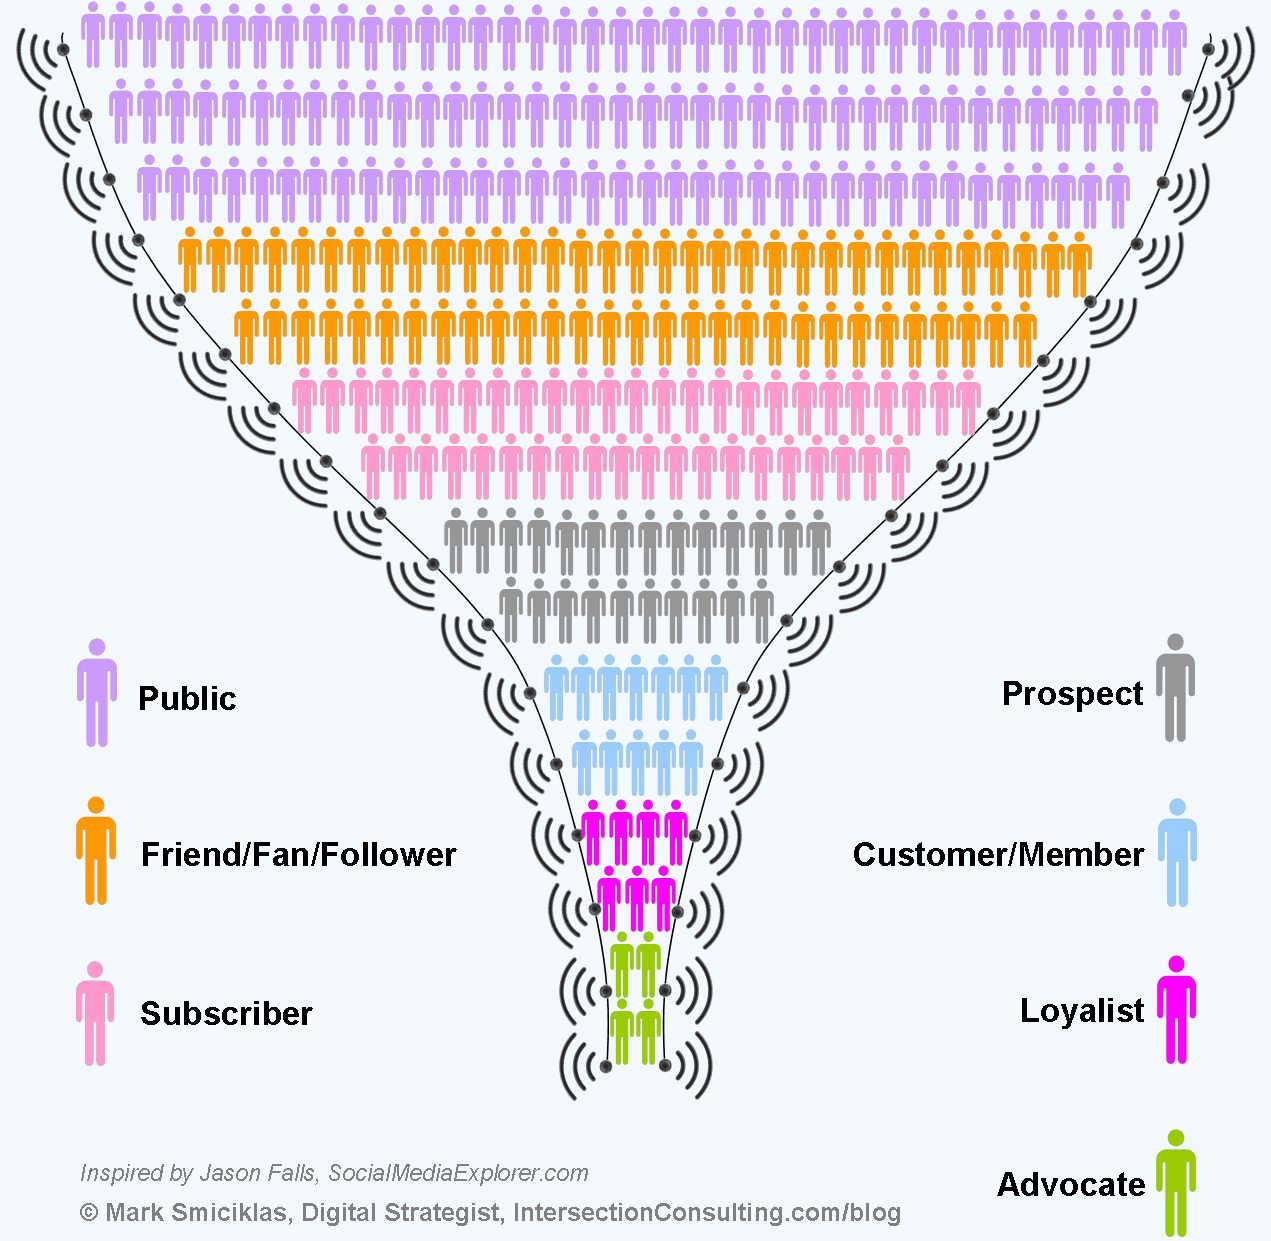
There are measurement opportunities at every stage of this journey. These are the big sections we’ll focus on in this post (click on any section to go to those metrics directly):
- Activity: The output of your social team
- Reach: Your audience and potential audience
- Engagement: Interactions and interest in your brand
- Acquisition: Creating a relationship
- Conversion: Actions, sales and results
- Retention and advocacy: Happy customers and brand evangelists
Activity metrics: The output of your social team
These are the numbers that show what you’re doing, the basic output of your social media team — including posting, scheduling and optimizing content, answering questions and solving problems. These can appear quite simple but become important to measure as you experiment and try new things. It’s great to be able to say whether increases in your activities produces increase in some of the other metrics we’ll be mentioning later on.
Average response time: The average time it takes a team member or brand representative to respond to comments and inquiries from the brand’s social media audience.
Content rate: The number of pieces of content you produce per period. Depending on which types of content you focus on, you might want to content post rate apart, focusing on:
- Blog posts per period
- Presentations per period
- Videos per period
- E-books per period
- White papers per period
- Infographics per period
- Other types of content creation per period
Post rate: Number of social media posts per period. Depending on which networks you’re active on, you might want to break post rate apart, focusing on:
- Tweets per period
- Facebook posts per period
- LinkedIn updates per period
- Google+ updates per period
- Pins per period
- Instagram posts per period
- Forum posts per period
- and any other social media networks you frequent
Post topic mix: The percentage of posts to each social media network per period broken down by content topic (e.g. resources, special offers, blog posts, etc.)
Post type mix: The percentage of posts to each social media network per period broken down by type (e.g., image, link, video, text, poll, etc.).
Response rate: The percentage of questions, comments or problems from people talking about your brand that you respond to within a certain amount of time.
Social media marketing budget: The amount of money your team is spending per period
Reach metrics: Your audience and potential audience

These are the metrics that focus on your audience and potential audience’s size and growth rate—as well as how often and how well your messages are tapping into that audience. Many social media management tools (like Buffer!) provide a number of these kinds of metrics.
Audience growth rate: The rate at which a brand adds (or loses) audience members per channel, found by dividing new audience members by total audience members
Average position: The average position where a brand’s ad appeared on a search engine results page (with the top position on the page being 1)
Brand awareness: The overall number of mentions of your brand online per period
CPM: Cost per thousand ad impressions in paid advertising
Fans/followers: The total number of people in your various networks per period
Influence score: Influence scores, offered by providers like Klout and Kred, measure how influential a person or brand is on a particular social channel
Keyword frequency: The number of times that a particular keyword or phrase is found within a brand’s social graph
Post reach: The estimated number of people who see a specific piece of your content at least once during a time period
Potential impressions: The number of times a piece of content could be displayed, regardless of whether it is interacted with, during a time period
Potential reach: The potential number of people in a brand’s audience, compounded by friends of audience members or others in a community who could have the opportunity to see a piece content, during a period of time
Share of audience: The rough percentage of people a brand will reach as compared to its competitors
Share of engagement: How a brand’s engagement metrics compare to others in similar fields
Share of voice: How big a brand’s portion of the conversation is compared to others in their space
Sentiment: Percentage of overall brand mentions that are positive, neutral and/or negative in sentiment
Video views: Number of views your video content gets on channels like YouTube, Vimeo or Facebook
Engagement metrics: Interactions and interest in your brand

These figures focus on how people are interacting with, sharing and re-sharing your content on social networks.
Amplification rate: The number of shares on average for each post. Depending on which networks you’re active on, you might want to amplification rate apart, focusing on:
- Twitter retweets
- Facebook shares
- Google+ shares
- LinkedIn shares
- Pinterest repins
- Instagram regrams
Applause rate: The number of approval actions, or virtual “applause,” you get from your audience per period, including +1s, likes, thumbs-ups, favorites, etc.
Average engagement rate: The percentage of your total audience that has engaged with your content in any way on a social channel per reporting period.
Comment rate: The average number of comments your content gets per post
Conversation rate: The number of conversations going on per social media post. On Facebook, Google+, LinkedIn, Pinterest and Instagram, this will be comments. On Twitter, it’s replies
Engagement as a percentage of audience: Total engagement actions across all social networks divided by total audience
Engagement per fan/follower: Total engagement actions for one network divided by the number of fans (or followers) for that network
Virality: The rate at which a piece of content spreads across the social web. A good way to measure this one is total shares per piece of content
Acquisition metrics: Building a relationship

At this stage, those who were once simply chatting with your brand on Twitter or Facebook may begin to dive deeper, poking around your site to see what you have to offer. Acquisition metrics focus on their experience there—whether your audience matches up with your offering and what value you provide. An analytics provider like Google Analytics can offer many of these metrics.
Blog subscribers: Number of subscribers to your blog
Bounce rate: The percentage of visitors who only went to a single page of your site, bouncing back to the place they came from rather than clicking further into the site
Click-throughs: The number of clicks on a link within a post on a given social network
Click-through rate: The rate at which your audience clicks on a link within a post on a given social network, found by dividing the number of clicks on a post by the number of impressions for the post
CPC: Cost-per-click (for paid search or social advertising)
Email subscriptions: Number of subscribers to your email list
Leads: The number of potential sales contacts earned through social media per time period
Links: Number of pages linking to a specific page of content on your site
Micro-conversions: Any measureable activity that a brand’s users frequently engage in before a conversion
Pageviews: Number of pages viewed or clicked on a site during the given time
Percentage of social visits: The percentage of traffic to your site that is referred by a social media source
Rank per keyword: Average position your content earns in a search engine for a specific key word or phrase
Sessions (formerly unique visitors): A group of interactions that take place on your website within a given time frame (A single session can contain multiple screen or page views, events, or social interactions)
Session duration (formerly time on site): Total duration of all sessions (in seconds) / number of sessions
Traffic: Number of visits and visitors social media drives to your sites per period
Traffic ratio: Percentage of traffic from each of three main segments, including:
- Direct visitors – Those who visit your site by directly typing your url in their browser address bar,
- Search visitors – Those who visit your site based on a search query
- Referral visitors –Those who find your site through another blog or site.
Conversion metrics: Actions, sales and results
The ultimate goal you hope a visitor will achieve with your brand is the focus of conversion metrics. Your conversion might be a sale, a subscription, a download, a signup or many other things. Again, a tool like Google Analytics might be handy here.
Average purchase value/average order value: The average value of each purchase made by your customers
Average revenue per customer: How much the average customer spends with a brand, found by dividing yearly revenue by yearly customer count
Conversions: Number of conversions per time period (Conversions can be defined as the ultimate action you’d like users to take on your site. Examples might be: email subscriptions, downloads, registrations, installations widget or tool, etc)
Conversion rate: The percentage of users who take a desired conversion action, found by dividing number of conversions by total traffic per period
CPA (cost per acquisition or cost per action): Dollar amount of how much a brand pays in order to attain a lead
Cost per conversion: Dollar amount of how much a brand pays in order to attain a conversion
New visitor conversions: Number of conversions that occurred per time period by visitors new to a brand’s website
Return visitor conversions: Number of conversions that occurred per time period by visitors returning to a brand’s website
RPC (revenue per click): the average amount of revenue generated per click in paid advertising
Social media conversion rate: The percentage of total conversions that can be attributed to social media, found by dividing social media conversions by total conversions
ROI or return on investment: Revenue generated by social media efforts divided by all known social media expenses
Retention metrics: Happy customers and brand evangelists
These KPIs—many of which go beyond the traditional social media metrics and into general business metrics—cover the last and perhaps most crucial state of the customer journey. This is where we make and create happier customers who can go on to be a brand’s most important sales force—in other words, we turn the funnel upside down.
Brand evangelists: Number of customers your brand would consider evangelists based on their social media advocacy
Customer annual or lifetime value: A prediction of the net profit attributed to the entire future relationship with a customer
Customer retention rate: The percentage of the total number of customers retained in context to the customers that have cancelled.
Customer reviews/ratings: Number of positive or negative customer reviews or ratings received per period
Customer satisfaction: A measure of how products and services supplied by a company meet or surpass customer expectation
Customer satisfaction rate: A score expressed as a percentage between 0 and 100, with 100% representing complete customer satisfaction. This metric is most often determined by a single question in follow-up surveys along the lines of, How would you rate your overall satisfaction with the service you received?
Customer turnover rate/churn: A measure of the number of customers who leave over a specific period of time
Customer testimonials: Number of positive customer testimonials gathered per period
K-factor: The growth rate of websites, apps, or a customer base
Net Promoter Score: To calculate this one, customers answer the question, How likely is it that you would recommend [your company] to a friend or colleague? using a scale of 0-to-10 points.
Support cost per ticket: The total monthly operating expense of a support team divided by the monthly ticket volume
Don’t forget…
As you might have noticed from a quick scroll-through of this post, there are dozens of metrics you could analyze. But only you will know which ones that tell you whether your strategies are working.
Don’t forget that you’re the expert. Make sure your metrics are working for you, not the other way around.
More great reading on social media metrics
From Buffer:
- Which Stats Matter: The Definitive Guide to Tracking Social Media Metrics
- 10 Expert Tips on Tracking Social Media ROI
- So…Is That Good? The Complete Beginner’s Guide to Benchmarking on Social Media
The Moz Blog: Tracking the KPIs of Social Media
Share your metrics!
Which social media metrics did I miss? And which ones are the most important to you and your brand? I would love to hear your thoughts in the comments!
Try Buffer for free
140,000+ small businesses like yours use Buffer to build their brand on social media every month
Get started nowRelated Articles

This article looks into social media benchmarks for various industries and platforms.

A guide to the content marketing metrics that will help you measure success, plus guidance from top content marketing leaders.

In this guide, we’ll go through everything you need to know about TikTok analytics — from what metrics and insights are available to how to get all of them for free to what you can do with them to boost your growth on TikTok.