


You’re rocking social media.
You’re finding great content to share, you’re writing the best headlines, you’re engaging and automating and seeing your brand soar.
How will you let your boss or client know all the great stuff you’re up to?
Is there an easy way to see for yourself how things are going?
Creating a social media report can be key to explaining your progress on social media. You can choose the stats that matter and deliver it in an easy-to-understand way; there’re tons of personal insights to gain as well as valuable info for your boss or client.
We’re grateful for the example of so many Buffer users who are already creating social media reports of their own to share with a boss or client. I’d love to share a bit about how these reports come together—and how you can make one for yourself.

Before we get into the details of the social media report, I thought it might be useful to go over the many different factors—metrics (and reasons for the metrics), timeframes, growth—that might go into a report.
In asking around with our awesome Buffer users, we found that social media reports can differ person-to-person and brand-to-brand in a number of ways.
First: Which stats matter to you?
A social media report is simply a collection of data and stats.
Which data and stats should be on there? And why?
The answer likely depends on your specific social media strategies and goals.
- Followers tell you the number of people who wish to connect with your brand. The benefits of followers are for the reach of your content, the social proof of your brand’s popularity, and in some cases a simple vanity metric to boost your confidence!
- Clicks tell you that the content you’re sharing is of personal interest to the user. Clicks send traffic to a URL and establish your social profile as a great resource for curated content.
- Retweets tell you that the content you’re sharing is perceived as potentially interesting to one’s followers. The benefits of retweets is for advanced exposure to people who aren’t your followers and social proof that you know what you’re doing on social media.
- Favorites are somewhat of a wild card. The benefit of favorites is as a social proof metric, and beyond that, it’s a bit hard to tell what people are thinking when they favorite because there are so many different strategies and reasons (curation, appreciation, bookmarking, etc.). On some channels, favorites/likes may surface the content higher into the News Feed.
Which timeframe is most valuable to you?
Here’re the timelines that have come up most often in our discussions:
- Weekly
- Monthly
- Quarterly
- From campaign start to end
(Note: For monthly reports, some use a 28-day period so that it’s consistent across all months, since the months may vary in length. Also, for quarterly reports, often a 90-day period is used, as you can fit four 90-day periods into a year.)
How do you want to track your progress and growth?
Also, there can be some differences in the way you view progress. For instance, are you most interested in seeing where you are today, or how you’ve grown from a previous point in time?
Here’re some of the different ways we’ve found to look at reports in this case:
- Snapshot – A look at the numbers for a chosen period, with no previous history considered
- Week over week, period over period – A comparison of stats for a chosen period with stats for the previous period, or even from the previous year
If you’re interested in digging further, we’ve written about goal-setting for social media, as well as some popular goal-setting strategies.
A Weekly Social Media Report Template

I put together a quick sample with some of the reports I talk about below. Feel free to grab a copy to use for your own purposes.
The report is built in Google Sheets, and it works off of a data export from Buffer. You can likely rig it to work with exports from other social media analytics tools as well.
Here’s how to use it:
- Go to your Buffer for Business dashboard and export your analytics for the past 30 days.
- In the Google spreadsheet on the “export” sheet, click on cell A:1.
- Go to File > Import. Upload your export file, and choose “Replace data starting at selected cell.”
- The “Report Card” sheet should automatically be filled in with data from the “export” sheet.
- Edit any of the headings or titles (e.g. Retweets for Twitter, Reshares for Facebook).
- You’re all set! There’s a Report Card view for online editing/viewing, and there’s a Print-Ready view that’s been formatted for creating pdfs and printouts.
10 Useful Ways to Create a Social Media Report
To come up with some of the report ideas listed here, we asked some of Buffer’s users what they do with the Export Analytics data from their Buffer dashboards.
Many of the reports you’ll read about can be made using Buffer’s Export Analytics feature, which is available as part of Buffer for Business. Also, you can create these reports with exports from Twitter Analytics and Facebook Insights.
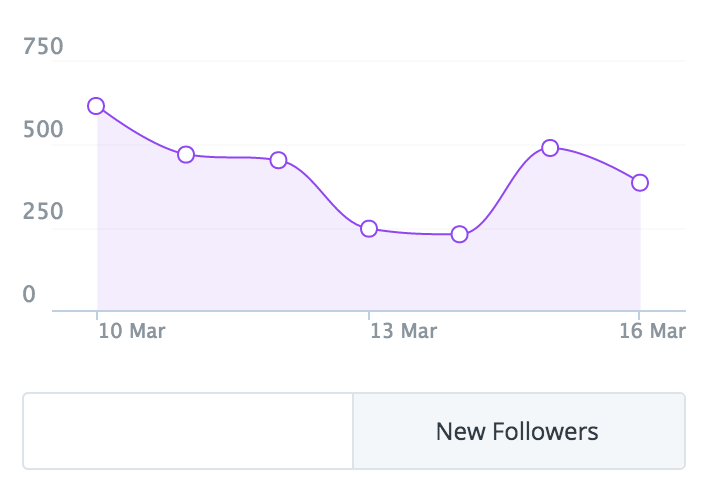
1. Follower growth
“We’re gaining 1,000 new followers every week!”
When your boss or client looks at followers, they could draw lots of conclusions: popularity, reach, brand awareness, etc. And each one is valid. People follow social media profiles for a variety of reasons, some to receive the content from that profile, some to show their affiliation for the brand.
As you grow the followers on your social media profile, your influence gets a little wider, both in the number of people you will potentially reach and in the perceptions others have of you. A growth report is a great way to capture these two ideas.
How to create the report:
The free version of TwitterCounter shows you stats on your followers, how the number changes on a daily basis, your daily average of new followers, and your projections for the coming week.
You can grab this information directly and place it into your report.
Also, follower info is available for all your Buffer accounts by going to bufferapp.com/weekly-digest.
Alternately, if you’re working from the dashboard of your social media management tool (say, Buffer for Business), you can view follower growth via the analytics.
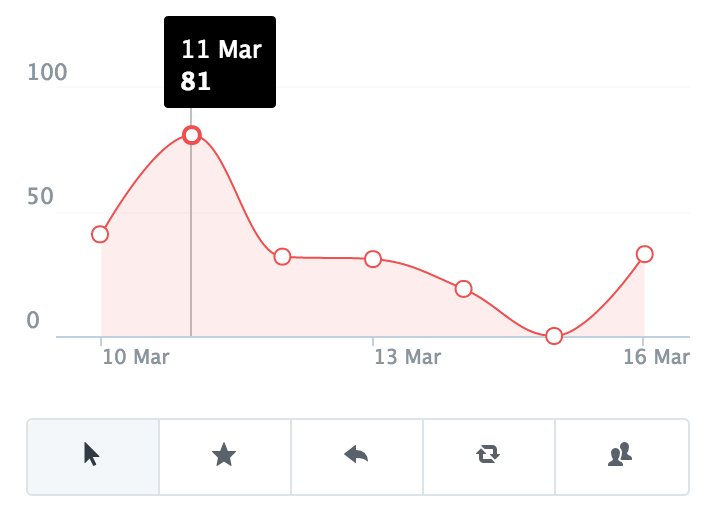
- On the Analytics tab, click to view followers on the analysis chart.
- Mouse over the starting date for your desired range. If you wanted to see weekly growth, hover on the data point for seven days ago.
- Jot down the follower count at the start of the range and at the end of the range.
Followers now (minus) Followers then = New followers gained
New followers gained (divided by) Followers then, multiplied by 100 = % growth
(I’ve found that follower growth is often best kept as a whole number, i.e. “I gained 35 new followers this week” as opposed to “My followers grew 0.3% this week.” The whole numbers seem a bit easier to compare.)
As you continue pulling these reports, you can also compare growth from week to week by looking at the New Followers Gained stat based on different time periods.
2. Influencer report
“Wow! Check this out! Taye Diggs is following us!”
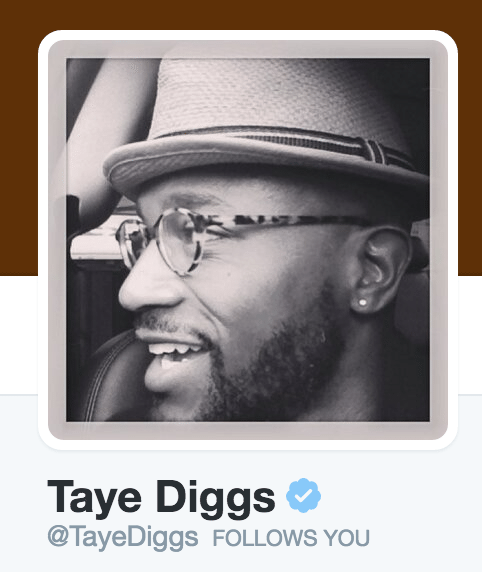
Sometimes, it’s just really cool to know that someone big or influential is following you. In the long run, it’s likely a vanity metric, yet it’s still a fun occasion to celebrate—and perhaps to share with your boss or client.
The practical value of having influencers among your followers is that any social media update of yours has the chance to take off big time. And influencers among your tribe is great social proof for others to see that you’re being taken seriously by big-time users.
How to create the report:
To identify Twitter influencers, Followerwonk and SocialRank are a couple of the handful of tools that can help identify influential followers.
Sign up at either of these websites, connect your accounts (Followerwonk focuses on Twitter, and SocialRank does Twitter and—coming soon—Instagram), locate the followers with the largest followings, and add it all to your report.
3. Volume of posts
“Here’s what we’ve been up to for the past month. 110 posts!”
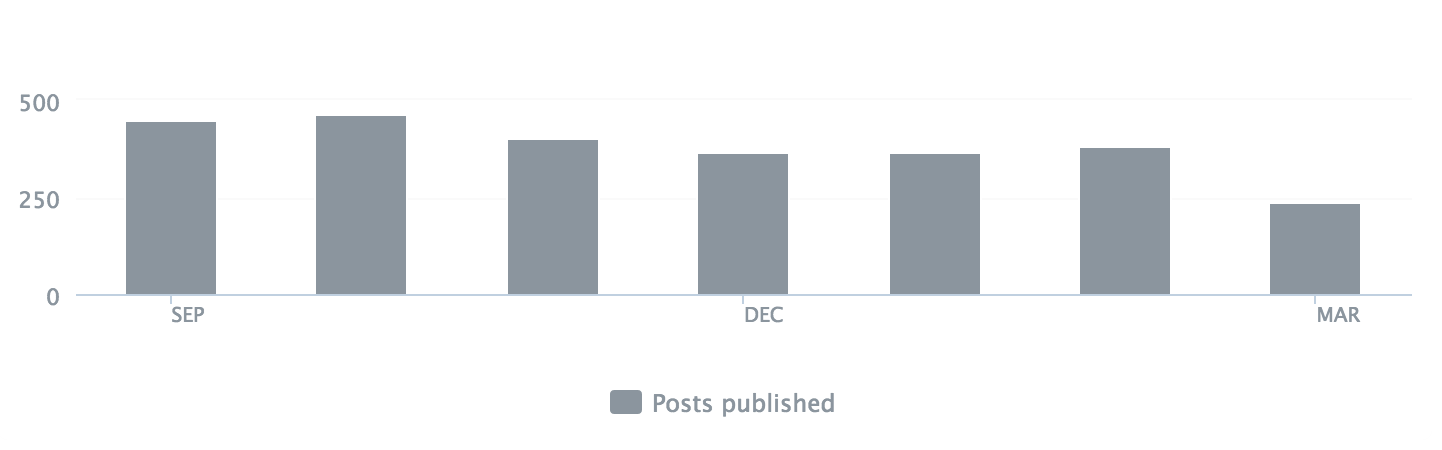
I was really interested to learn that one of the key reports that people run is a simple counting of the number of times they’ve shared to a social network. The report shows quantity of posts. You can compare it to previous periods to see how the volume has changed over time. (You can go super advanced and see how volume affects other stats like engagement and follower growth, too.)
How to create the report:
- Export the data from Buffer, Twitter, or Facebook.
- The export file will contain rows of your social media updates with columns for the individual stats on each update.
- Count the number of rows (which equals the number of posts) by running this formula:
=COUNT(A:A)
“A” represents the column with the update text.
4. Reach Rate
“Lookit! Our posts are seen by 10 percent of our fans.”
One of the Buffer users who shared some reporting insights with us had a great description for their process. Their team looks for reach and resonance.
Reach is the amount of people who might see a post.
Resonance is the interactions with the content.
Reach can sometimes be a bit of a tricky term. Facebook uses it to refer to the number of people who see a post. Twitter calls the same thing Impressions. Either way, this metric can often be the best way to understand exactly how many people are seeing the content you share (the actual reach), regardless of how many followers you have (the potential reach).
How to create the report:
Twitter Analytics is currently the best place (and maybe only place) to find Impressions data for tweets. When you export your data from Twitter, one of the columns will be impressions for each tweet.
Buffer tracks reach for Facebook and potential reach for Twitter (potential reach is the sum of your followers plus the followers of those who retweeted you).
Get the reach/impressions per post by totaling up reach and dividing by the number of posts.
Reach per post (divided by) total followers = % of followers who see your content
5. Total engagement
“Does our stuff resonate with people? You betcha! 425 total interactions this month.”
Total engagement can mean different things to different people. In general, engagement is the sum of clicks, reshares, likes, and comments—basically every interaction one can take on a social media update.
What this information tells you is the overall effectiveness of your tweet. Did people like what you shared? If so, engagement will be high, regardless of whether the interaction was mostly due to one metric over the others. Engagement is the catchall for social media success. Good engagement = good sharing.
How to create the report:
- Export the data from Buffer, Twitter, or Facebook.
- In some cases, engagement may already be added together for you. If not, add up the total interactions in the columns for clicks, reshares, likes, and comments.
- Done!
6. Engagement per post
“Every time we post, we can expect to get 25 interactions!”
The next step from the total engagement figure above is engagement per post. Instead of looking at total engagement for a certain period (which can fluctuate based on how many times you post), you can drill down into engagement per post, which shows a somewhat clearer picture of exactly how engaged people are with your content.
How to create the report:
Divide total engagement by number of posts.
7. Engagement per follower
“Nearly 3% of our followers engage with us each time we share an update! Wahoo!”
The cool thing about tracking engagement per follower is that you get a sense of how you might be able to scale your social media sharing. If you’re working to gain more followers, and you know you’re capable of getting a certain engagement/follower, then you’re likely to see your engagement go up. If you’re able to move the needle on engagement per follower, you’ll likely see an even bigger jump in engagement once your followers increase.
Another super helpful area for you, the social media manager, is using this stat to compare performance across multiple social channels, for instance Twitter vs. Instagram. Engagement per follower helps to normalize your metrics and easily compare.
How to create the report:
- Add up the total engagement for your posts (see above). Divide by the number of times you’ve posted.
- Take this engagement per post figure and divide by the number of followers you have.
8. Clicks
“Our social media posts have sent 350 visits back to our website this week!”
We’ve been using clicks as a key part of our goals and strategy for several months (if not years) here at Buffer. Clicks are the most direct metric that you can tie back to your website. When someone clicks, a couple of great things happened: 1) you wrote a great headline or created an awesome visual, and 2) that person is now checking out your site, signing up for email lists, reading more articles, advancing into the marketing funnel.
How to create the report:
Export the data from Buffer, Twitter, or Facebook.
If you’re interested in total clicks, add up the clicks from each post in your date range.
If you’re interested in clicks per post (a favorite metric of ours), divide the total clicks by number of posts.
If you’re interested in clicks per followers, take the clicks per post number and divide by total followers.
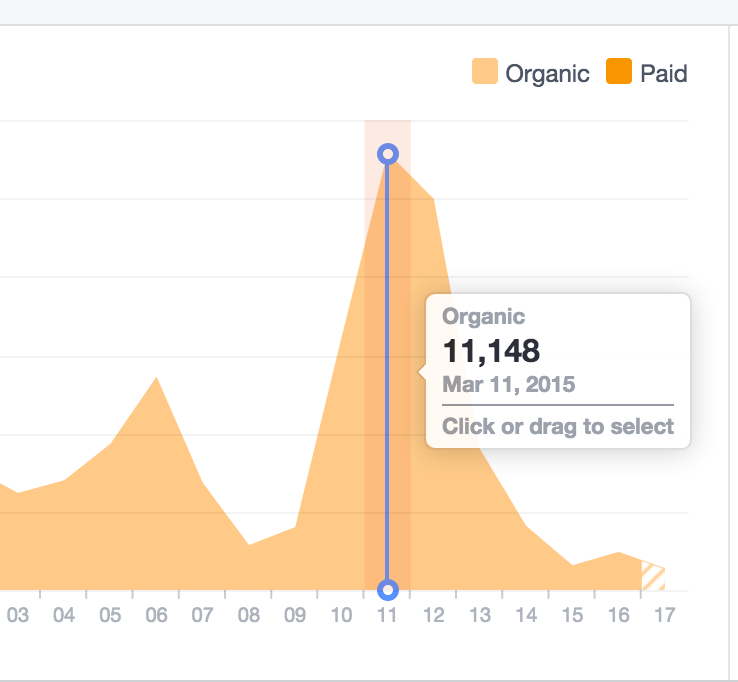
9. Social referral traffic
“Look at how many visitors to our site have come through social media!”
Clicks are a great way to measure the success of your individual posts. Social referral traffic is a great way to show how successful a social network as a whole is for driving people to your website.
With social referral traffic, you see how many visits each social network sent to your site. This would include any links that you shared personally as well as any links that were shared by others on social media. When seen side-by-side with organic traffic, referral traffic, and direct traffic, it does a great job of putting the impact of social media into perspective.
How to create the report:
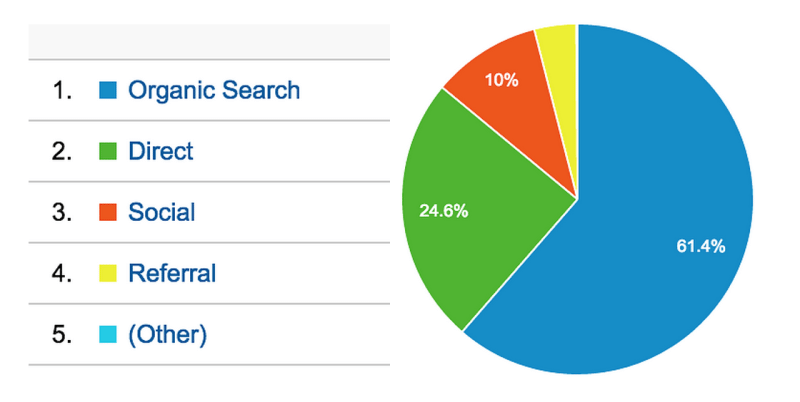
In Google Analytics, go to All Traffic > Channels.
This report will show the percentage of traffic that comes from social, alongside traffic from search, direct, referral (other websites), email, and other.
To see the individual breakdown of traffic by social network, go to Acquisition > Social > Network Referrals.
This report will show you how much traffic has come from each website.
10. Funnel stuffs
“See these sales? How cool that these people started their buying journey on social media!”
For advanced users, funnel reports show not only the clicks and referral traffic back to your site but also where that traffic ends up going and what they end up doing. Does your social media traffic convert into leads? Into subscribers? Into sales? The funnel reports take into account the whole visitor journey, from tweet to visit to action.
How to create the report:
There are lots of ways to go about funnels. There are some helpful tutorials from KISSMetrics and Social Media Examiner that do a good job of going really in-depth on the topic.
One quick way I’ve found to set up some simple funnels tracking is to use Google Analytics Goals.
- After logging in to Google Analytics, click the Admin link at the top of the page.
- Select your website from the drop-down list at the left, and in the right column of the page, click on Goals.
- Click the “+New Goal” button.
- Give the new goal a name, choose the type of goal you want to create, and set the goal details so that Google Analytics knows when a goal is reached
Once this is all set up, you can view the analytics data for this goal—including the amount that social media contributes to goal conversions—by clicking on Conversions > Goals in your Google Analytics dashboard.
Over to you
How do you go about creating social media reports?
Have you tried looking at some of the above stats?
I’d love to hear about your experience (and if Reports is a feature you might find useful in Buffer!). I’ll look forward to hearing from you in the comments!
Image sources: Pablo, UnSplash, IconFinder, Death to the Stock Photo
Try Buffer for free
140,000+ small businesses like yours use Buffer to build their brand on social media every month
Get started nowRelated Articles

This article looks into social media benchmarks for various industries and platforms.

A guide to the content marketing metrics that will help you measure success, plus guidance from top content marketing leaders.

In this guide, we’ll go through everything you need to know about TikTok analytics — from what metrics and insights are available to how to get all of them for free to what you can do with them to boost your growth on TikTok.