


We love to make decisions and form strategies based on statistics. It’s why we A/B test and how we change directions on our social sharing.
Who doesn’t love a good statistic, especially one that has an actionable next step?
You’re likely to find a sea of statistics for social media—I know I’m amazed at how many are out there. My favorite finds are those that are just a bit surprising or unique or even counterintuitive.
I’ve saved some of the best social media stats I’ve found over the past few months and I’m happy to share them here with you. Keep reading to see some fun, surprising, and (you guessed it) actionable stats for how you can better share on social media. Got any stats that you’ve found helpful? I’d love to hear about them in the comments.
1. Your biggest advocates have the fewest followers
When looking at your social media monitoring strategy, note that your brand/company mentions on social will likely not come from social’s biggest players. Very few, in fact, will.
Social monitoring website Mention analyzed over 1 billion social mentions from the past two years, and in their analysis they found that 91 percent of mentions come from people with fewer than 500 followers.
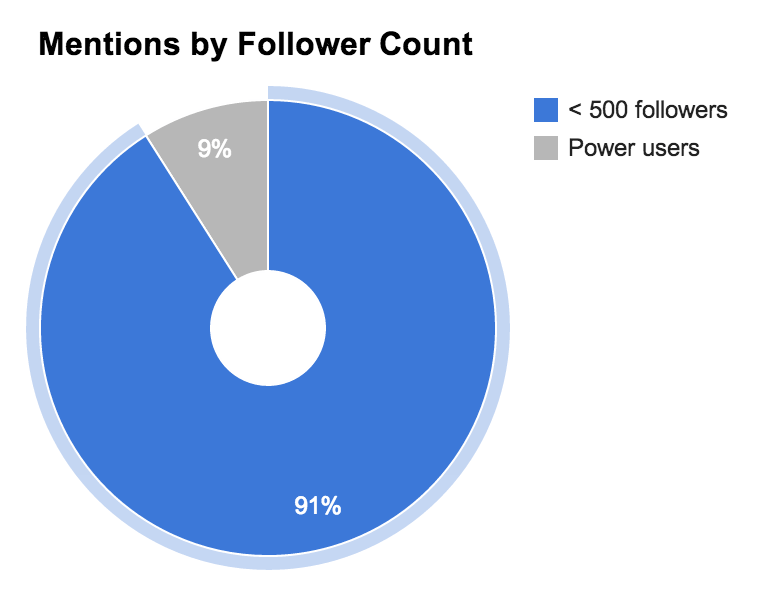
And these are potential brand advocates—only 6 percent of the mentions in this study were deemed overtly negative.
What you can do with this stat: Putting this stat another way, fewer than 1 out of every 10 mention will come from a power user. You can prioritize these power users if you want, but it’s also important to give a quick and delightful response to those with few followers—the vast majority of those talking about you.
2. Twitter has 6 distinct communication networks
The Pew Research Center and the Social Media Research Foundation combined on a report that analyzed thousands of Twitter conversations to come up with six distinct communication networks. Which of these six do you most closely identify with?
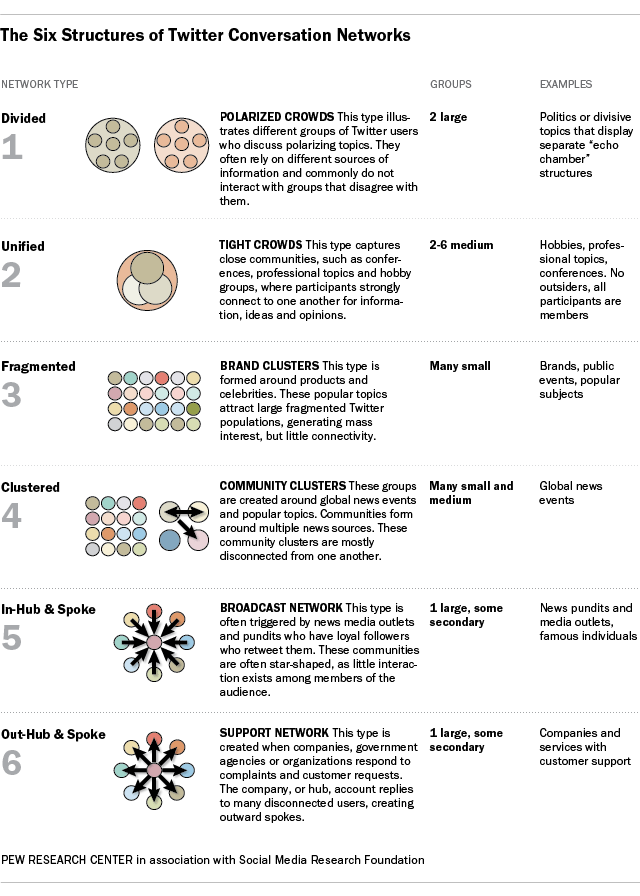
What you can do with this stat: Tight crowds and community clusters seem like apt groupings for brands interested in a lot of engagement. Support networks, too, can be a type of communication network for brands, especially if you are doing customer support on Twitter. Analyze your own place in these Twitter networks to see where you fit and if you need to change your strategy to mix with a different group.
3. Marketers say written content trumps visuals
Social Media Examiner’s annual survey of nearly 3,000 marketers leads to a ton of insights into how marketers think about social media and sharing.
Interestingly enough, in a social landscape dominated by visuals, it is written content that most resonates with marketers. Over half of marketers (58 percent) claim written content is their most important form of social content. Visual content came in second (19 percent.)
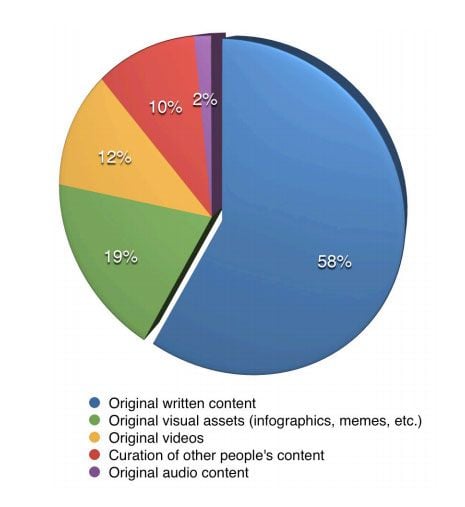
What you can do with this stat: Original written content can be a great opportunity for thought leadership, authority, and brand awareness. When you’re creating new content to share, keep in mind the power of storytelling. If you’d rather zig while the others zag, this stat shows you some fertile ground for developing lesser practiced strategies, like focusing on visual content.
4. You have less than an hour to respond on Twitter
Consumers expect a lot from you on Twitter, as recent research by Lithium Technologies confirms. The real-time nature of Twitter has led to incredible expectations. According to Lithium, 53 percent of users who tweet at a brand expect a response within the hour. The percentage increases to 72 percent for those with a complaint.
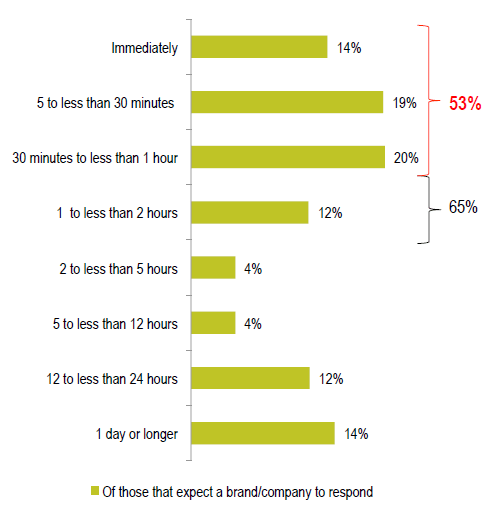
What you can do with this stat: Tools like Must Be Present can help you track your response time on Twitter, or you can invest in software like Spark Central to stay on top of your customer support tweets. At the very least, consider the timeliness of your response to your Twitter followers: Either grab a monitoring service to manage your timeline or get really good at checking your Twitter email alerts.
5. Late night is the best time for retweets
TrackMaven analyzed over 1.7 million tweets to come up with data behind the best practices for earning a retweet. The best time of day to tweet for a retweet? After-hours, between 10:00 p.m. and 11:00 p.m. ET.
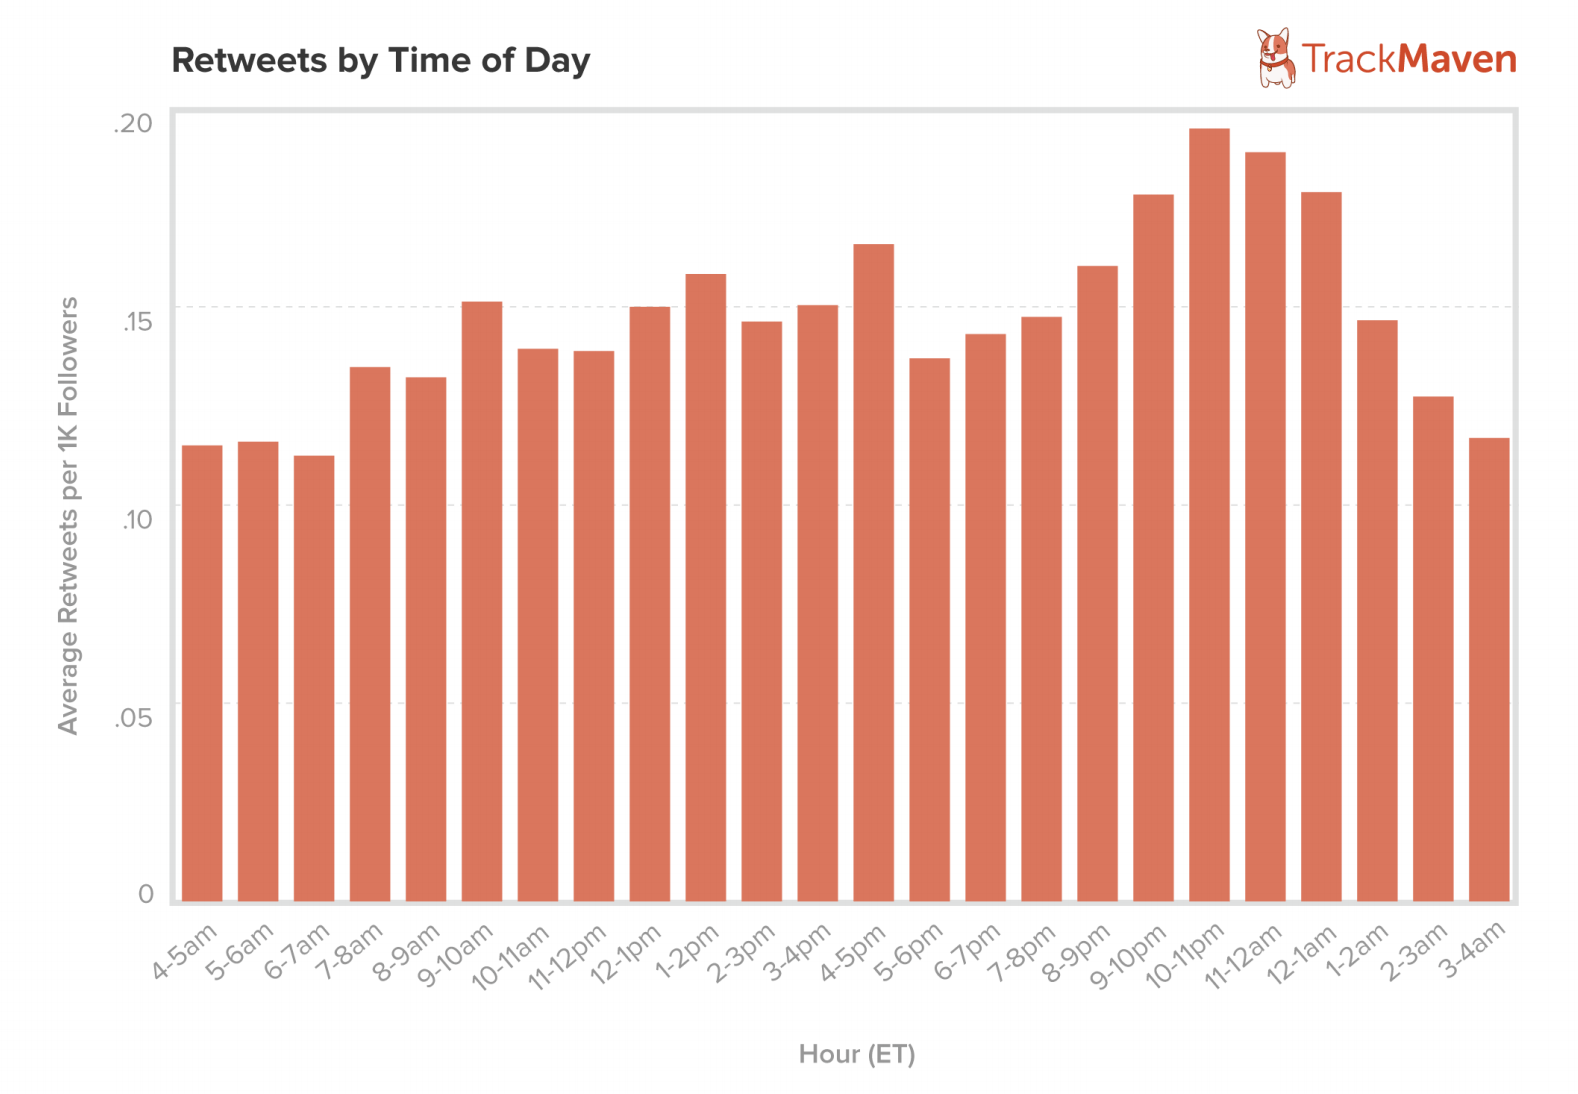
This advice follows the Late-Night Infomercial Effect (share when share volume is lower, and your content has a greater chance to stand out), so it makes sense to see that engagement after hours would be highest. Track Maven also found that Sundays are the best day of the week to get retweets and that tweeting with the word “Retweet” or with all caps or exclamation points leads to more retweets.
What you can do with this data: Test out the after-hours theory with some of your own tweets and see how engagement changes based on the time of day and day of week that you tweet. If you’re feeling particularly bold, you can try all caps and exclamation points, too.
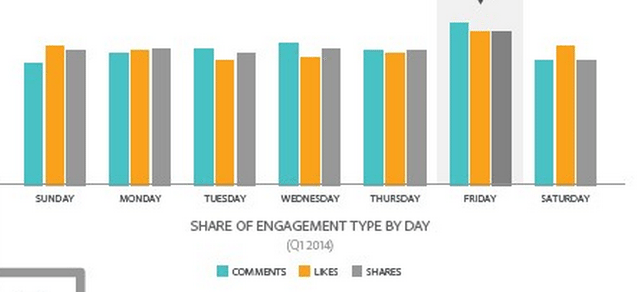
6. Fridays are Facebook’s best day for engagement
The Social Intelligence Report from Adobe analyzed over 225 billion Facebook posts from the past two years to come up with some data-backed recommendations for Facebook marketers. Their research on the best day to post pointed to a clear winner: Fridays, which receive more comments, likes, and shares than any other day of the week.
What you can do with this stat: Be sure that your posting schedule includes a Friday post, and you might even consider saving your best stuff for the end of the week.
7. Photos drive engagement on Facebook pages
It’s likely that a stat about the power of visual content is not surprising to you, but how about a stat of this magnitude? According to Social Bakers, 87 percent of a Facebook page’s interactions happen on photo posts. No other content type receives more than 4 percent of interactions.
What you can do with this stat: The obvious takeaway here is to post more photos—and not just any photos. Choose photos that support your post or tell a story on their own. Certainly, Facebook pages are already embracing photos as posts: 75 percent of page updates are photos.
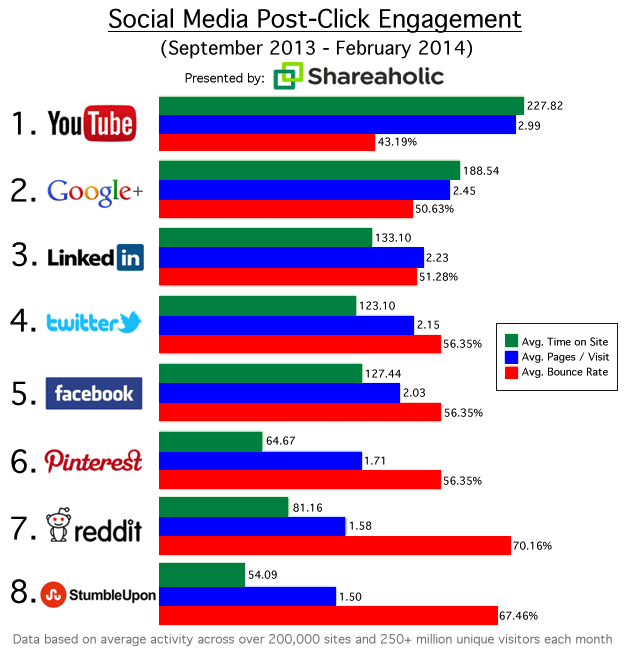
8. Facebook, Pinterest and Twitter drive the most traffic
Social sharing site Shareaholic revealed an interesting split in the way that social media sites refer traffic back to a website. Turns out, the data points to social being a source of either quantity or quality.
In terms of quantity, Facebook, Pinterest, and Twitter are the top three referrers of traffic. The Shareaholic study looked at a four-month period of data (December through March), covering more than 300,000 websites. In their study of engaged traffic, the lowest-performing sites for referral volume came out on top for engagement.
YouTube, Google+, and LinkedIn ranked as the top three sources for referrals in terms of time on site, pages per visit, and bounce rate.
What you can do with this data: Get involved in social media accordingly. If you’re after a big reach and spreading brand awareness, go with Facebook and Twitter, and think long and hard about joining Pinterest, too. If you’re interested in more qualified traffic, then be sure to invest time in Google+, LinkedIn, and YouTube. These stats recommend a broad social strategy, if you have the time and resources to pull it off.
9. Aim for 28, 118 or 385 interactions per post (it depends on your total fans)
As Facebook page reach has declined, we marketers are left wondering what constitutes good engagement these days. Earlier this year, Social Bakers analyzed more than 40,000 pages to see exactly where the average engagement lies for pages of all sizes. Pages with 1 to 9,999 fans: 28 interactions per post 10,000 to 99,999 fans: 118 interactions per post 100,000 to 499,999 fans: 385 interactions per post
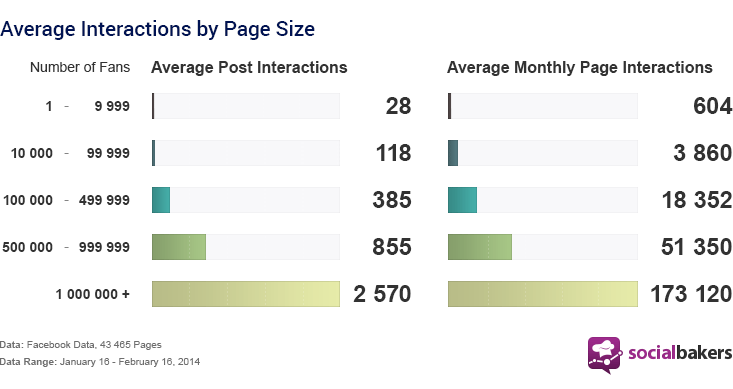
Interactions represent the total of comments, shares, and likes. In addition to the benchmark data above, Social Bakers also found that interactions on a particular post are directly correlated to a post’s reach. The more engagement a post gets, the more people will see it.
What you can do with this stat: Measure your Facebook page’s success against the benchmarks in this Social Bakers study. As time goes on, reach and interactions may continue falling, so these targets could be great to aim for but not the end of the world if you miss.
10. There’s a best day for everything on Pinterest
The Pinterest blog recently revealed which categories get the most engagement on each day of the week. Here’s how the calendar lays out:
Monday: Fitness
Tuesday: Technology
Wednesday: Inspirational quotes
Thursday: Fashion
Friday: Humor
Saturday: Travel
Sunday: Food and crafts
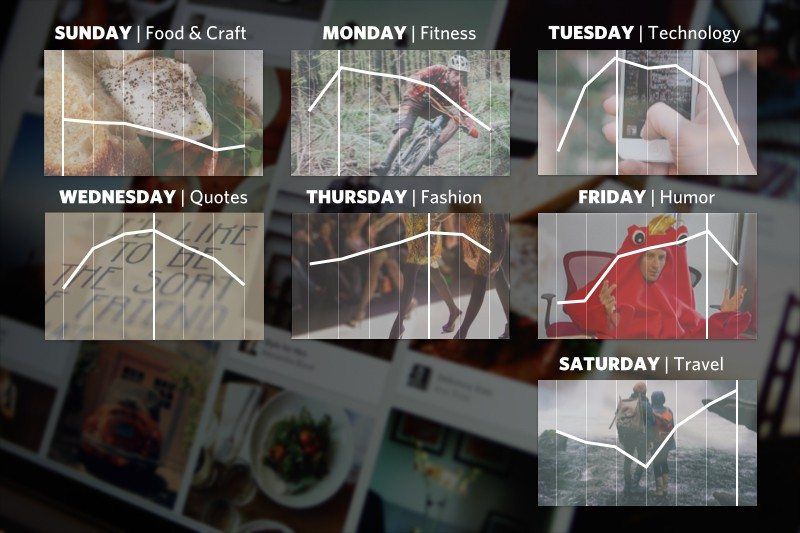
What you can do with this data: If possible, create a Pinterest board that touches on each of these seven topics, then build this sort of specific sharing into your Pinterest schedule.
Recap
Data and statistics like these can give you a good starting point for testing out your own action steps and strategies. Start with these stats, test them for yourself, and find the best system that works for you. Then come back and share! I’d love to hear how it goes for you.
Which of these social media stats stood out to you? Which ones might you act on? Do you have any favorite stats that have driven your social media decisions lately?
Image credits: photosteve101, Social Bakers, Social Media Examiner, Pew, Adobe, emarketer, Track Maven, Shareaholic, Pinterest, Mention.
Try Buffer for free
140,000+ small businesses like yours use Buffer to build their brand on social media every month
Get started nowRelated Articles

In this article, Nupur Mittal shares insights into four research methods that help her find content ideas and identify unique takeaways.


Facebook marketing in 2019 isn’t dead. On the contrary, it’s far from it. Now removed from the dim outlook that businesses faced at the beginning of 2018, Facebook has and will remain an essential tool for brands’ marketing strategies moving forward. In our big State of Social Media 2019 Report, we found that 93.7 percent of businesses use and are currently active on Facebook — the most among any other social media network. And although we continue to see a dramatic rise in the usage