
Square vs. Landscape Video – $1.5K Worth of Experiments: Here’s How They Compare


In an effort to get to the bottom of what makes videos successful on social media, we set out to answer two not-so-simple questions:
- Where does video perform best?
- In what format does video perform best?
What we found is that there are so many ways to go about it! Video format, length, content, captions, and graphics (to name a few) all play a big part in the success of your video content.
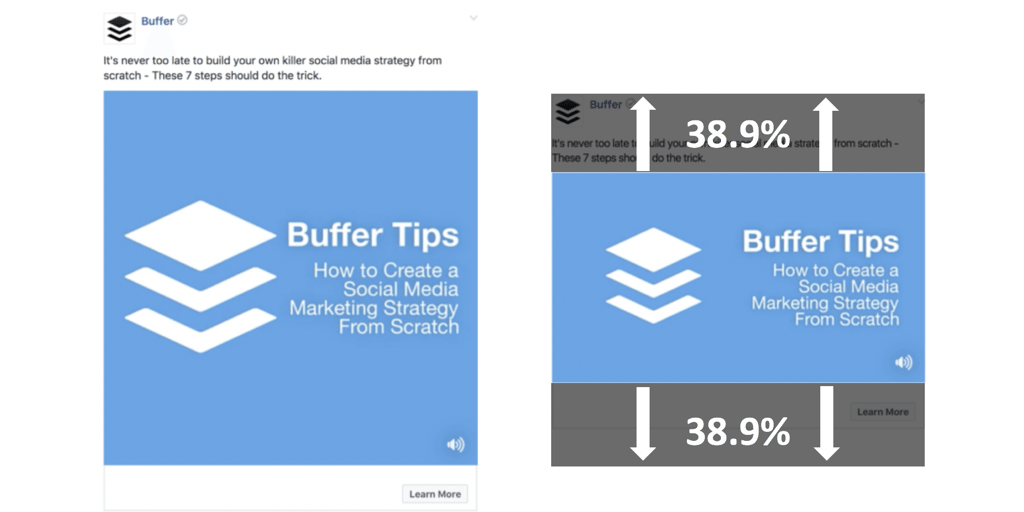
But one stat really stood out to us: Square video (1:1) takes up 78% more real estate in a person’s mobile newsfeed than does landscape video (16:9).
That’s a lot of space! And with mobile content consumption on a dramatic rise, this felt like something we had to get to the bottom of.
So we teamed up with the video experts at Animoto to test (and test again) the hypothesis that square video would perform better across the board on social media than the traditional landscape video.
The results were fascinating!
We’re excited to dig in and share our research with you along with several actionable takeaways for marketers looking to up their video marketing game in 2017.
Let’s do this!
3 Important takeaways to guide your video marketing strategy
Video and mobile are on the cutting edge of social media and marketing and so we’re super excited to share this actionable research with you. By the end of this article, you’ll be equipped with data-backed ideas and insights that you can apply to your own videos today.
But first, a few key takeaways to set the study up!
1. Mobile content consumption is exponentially increasing
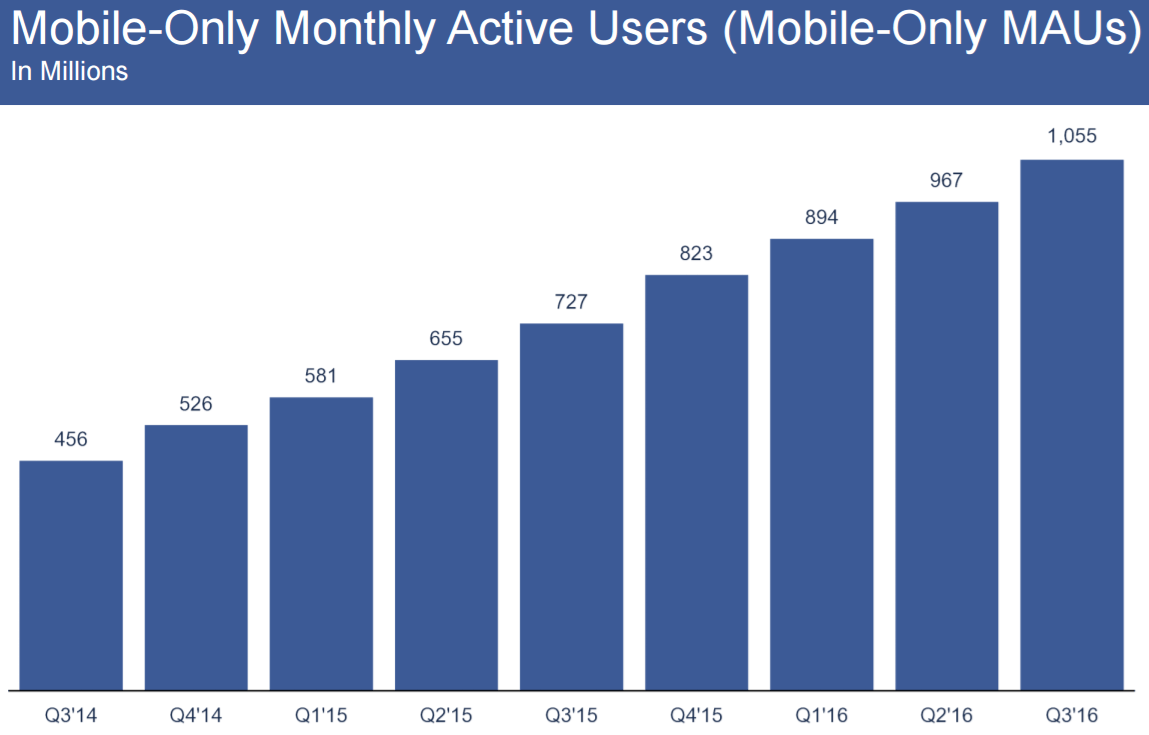
VentureBeat recently found that Facebook alone now boasts 1.09 billion mobile daily active users (a 22% increase year over year). Meaning that more than 92% of Facebook users access it via mobile, making it critical that businesses optimize their content for the mobile user.
Social media in particular is at the forefront of this monumental shift from desktop to mobile. Understanding the marketing tactics and strategies that cater specifically to a mobile audience will help to set brands apart.
The takeaway: Experimenting with video format is only one of the numerous ways to deliver content in a mobile-friendly way to users. Apps, mobile-optimized websites & email, geolocation tags, and QR codes, among other tactics are all things for marketers to consider moving forward.
2. Square video outperformed landscape video in views and engagement
Square video outperformed landscape video on each social media network in terms of video views, engagement (likes, comments, and shares), and completion rate (%).
In some cases, square video resulted in 30-35% higher video views and an 80-100% increase in engagement.
The takeaway: Video format, regardless of the content, seems to play a huge roll in how many people watch your video, how long they watch it, and how willing they are to engage with it.
3. It costs significantly less to advertise to users using square video on mobile
Our experiments revealed the fact that it costs 7.5% less to get someone to engage with square video on Facebook and a whopping 33% less to get someone to engage with square video on Instagram.
We also found that the cost savings continues upward as users watch more of our video on social media. In other words, the more video content the better!
The takeaway: Putting your advertising dollars behind square video on both Facebook and Instagram will help you to achieve greater results for a lower cost.
Click to jump to a specific section:
Below are the full details from our study on everything from how we set up the video tests to how much we spent along with the surprising results! Here’s a quick look at what we’ll cover:
- The square video & mobile hypothesis
- The various tests we ran
- Important video advertising takeaways
- Key results from the experiments
- Other video learnings
- Overall conclusion
- What’s next?
The square video & mobile hypothesis
This whole project with Animoto started with one eye-opening stat: square video takes up 78% more real estate in a person’s mobile newsfeed than does landscape video.
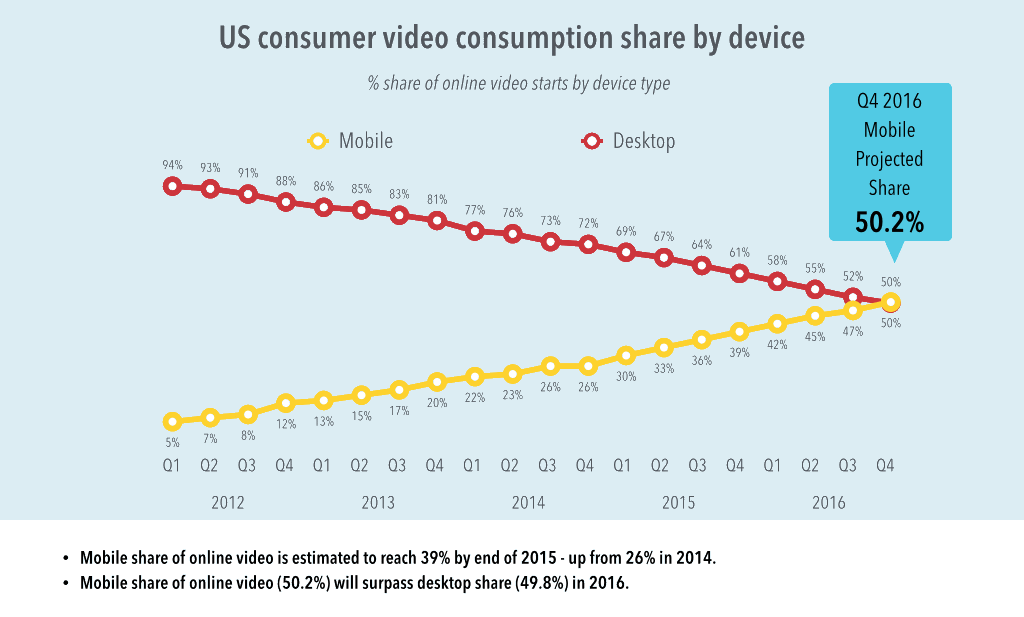
Shortly after seeing that stat, we read Ooyala’s Global Video Index report that showed video consumption on mobile has increased 233% since 2013. And that in Q4 of 2016, more than 50% of all video views came from mobile devices, finally surpassing desktop (with that number steadily increasing).
With mobile video consumption growing by the day, we wondered if square video would be the new “norm.” It would make sense, right? Traditional landscape videos (16:9) shown on mobile are typically 1280px X 720px (wider than they are tall). Whereas, square video (1:1) expands to fit the height ratio and become 1280px X 1280px.
Seeing how mobile screens are taller than they are wide, square video naturally would take up more newsfeed and lead to greater engagement – things like views, likes, comments, shares, completion rate, etc.
Or at least that’s what we hoped to find out!
We got to work figuring out which variables to test, how to set up and run the experiments, what social media channels we should test the videos on and a ton more.
The various tests we ran
We wanted to really hone in on what makes video content successful and so we attempted to keep the tests as simple as possible. Here’s how we set everything up:
Networks
We identified the three social media networks where we could easily test the various video formats: Facebook, Twitter, & Instagram. From the get-go, we decided to only test through the Buffer social media accounts so that we could compare the results to previous videos and not run the risk of varying results due to things like interests, audience size, voice and tone, etc.
Video topics
Next came the ideation phase where we created a ton of different video topic ideas and threw them into an Excel spreadsheet. These were split up into “talking-head” videos and “text-only” videos. This allowed us to be able to not only test what role format plays in video success, but also if having a live person in a video makes a difference in results.
Example of a talking-head video we tested:
No need to be a pro to get started with video! ? Here’s a simple 4-step guide on creating engaging videos using only your phone. pic.twitter.com/mCQCvoxjli
— Buffer (@buffer) February 26, 2017
Example of a text-only video we tested:
There are an incredible amount of social media tools on the market! Which ones work? Our top 5 must-try social tools of 2017 ⚒ pic.twitter.com/PyluAPJUya
— Buffer (@buffer) February 23, 2017
Videos and formats
Using the Animoto product we created nine videos total – with four different formats per video:
- Square (1:1)
- Landscape (16:9)
- Letterbox with Text (1:1)
- Letterbox without Text (1:1)
Each video varied in timing and topic, but the rest of the variables remained consistent to ensure testing validity and conclusive results.
An example of a letterbox video with text for reference:
Before you hit send! Here are 6 important questions to ask before every social media post ? #SocialSmarter pic.twitter.com/7mOBrp5FhG
— Buffer (@buffer) March 3, 2017
An example of a letterbox video without text for reference:
Figuring out the best times to post on social can be tough! Here are the exact times that work for us ⏰? #SocialSmarter pic.twitter.com/lzzmOWi91v
— Buffer (@buffer) March 4, 2017
Mobile vs. Desktop
One of the key parts of our study and analysis, along with format, was to test the effect of mobile vs. desktop on video results. There have been some incredible stats released in the recent months on the growing popularity of mobile content consumption. VentureBeat recently found that Facebook alone now boasts 1.09 billion mobile daily active users (a 22% increase year over year).
In other words, over 92% of Facebook users access the platform via mobile – making it critical for businesses to optimize their content for the mobile user.
When setting up our various campaigns within Facebook Ads Manager we made sure to split test on mobile vs. desktop. These were some of the most surprising and exciting results which we share below!
Cost-wise, we spent just over $1,500 dollars on testing each of the video ad sets on Facebook and Instagram. Roughly $150 per Facebook ad set and $75-$90 per Instagram Ad Set.
Each of the ad sets contained the exact same audience demographics. Here’s a quick look at our audience targeting:
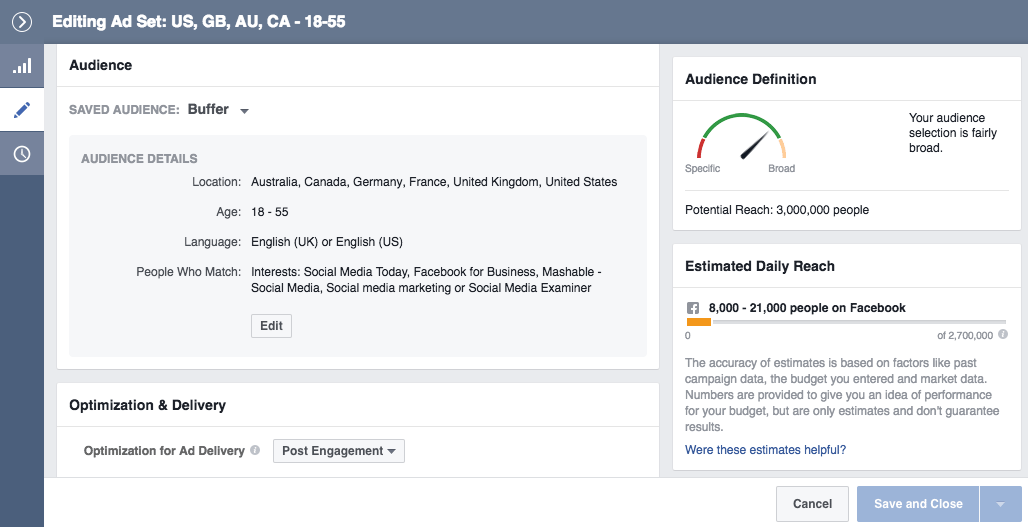
Then came the exciting part – we began testing!
Video strategy & launch
Instead of simply releasing the videos across social media, we opted to run each video as an advertisement on Facebook & Instagram and organically on Twitter. Approaching it this way would allow us to run true, unbiased A/B tests with each variation using Animoto’s best practices. We kept our targeting consistent with our normal targeting, ensuring that the same users would see our ads. This would prove helpful when comparing results to historic averages.
We also isolated each test by network and by device, allowing us to view performance of Instagram vs. Facebook and mobile vs. desktop – ensuring that each specific silo was given the same advertising dollars. Another benefit of setting up the tests this way was that we were able to minimize the chances that a single user would be presented with different variations of the same video. It also gave us more in-depth analytics on the true performance – CPM, specifically, as the industry standard in analyzing the performance of advertisement impressions.
We took a slightly different approach to Twitter. Without a true method to A/B test posts and ensure that users would be bucketed into different variations, we opted to post organically across a longer period of time.
With the testing strategy in hand, we set off to make the videos. In all, we created videos for 10 different pieces of content and, for each video, we produced between two to four variations that allowed us to answer a number of questions:
- What video format do people watch and engage with more?
- What video format leads to a greater completion rate?
- Does mobile vs. desktop play a role in engagement and completion rate?
- Does the social network make a difference?
We were also able to test content-based hypotheses to prove or disprove commonly discussed video best practices.
- How do text-only videos perform vs. taking-head videos?
- What role does visuals play within the first 3 seconds of a video?
- Do we see a significant drop off in view rates as the video length increases?
After posting and tracking over 80 video posts across 3 weeks, the picture became much clearer.
3 Important video advertising takeaways
And now for the exciting part – the results!
Each of these are based on the various data points we discovered from running more than 80 video tests within the Facebook Ads Manager platform.
If you’re curious about our advertising methodology, Animoto has written a great resource about creating effective video variations and the art of A/B testing.
Advertising Takeaway #1: To maximize your dollar, target mobile users with video (square video or landscape video)
First, we looked at pure Cost Per Thousand (CPM) on all of the tests we ran to compare costs. What stood out to us most was that desktop video CPM was nearly 2X the cost of mobile video CPM across the board.
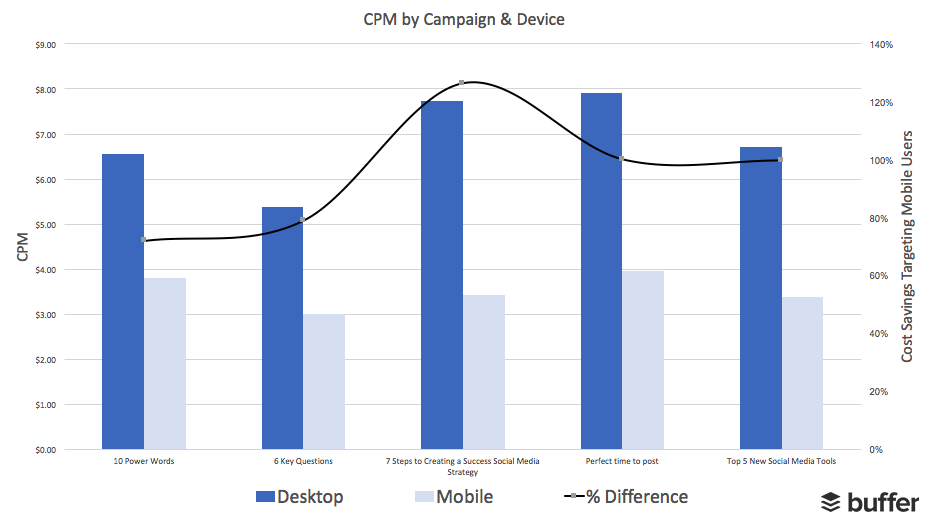
In other words, it cost nearly double to reach the same amount of people on desktop as it did on mobile. Marketers can immediately benefit from specially targeting users via mobile advertisements.
Advertising Takeaway #2: Users engage with square video more on mobile; significantly more on Instagram
It costs 7.5% less to get someone to engage with square video on Facebook and a whopping 33% less to get someone to engage with square video on Instagram.
(Cost Per 3s Mobile Views – Instagram)
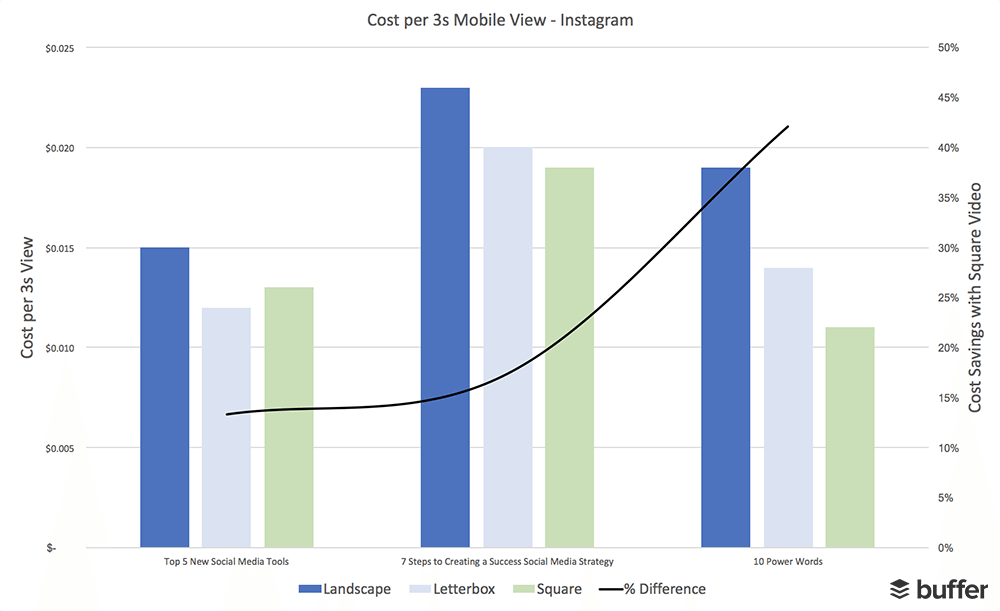
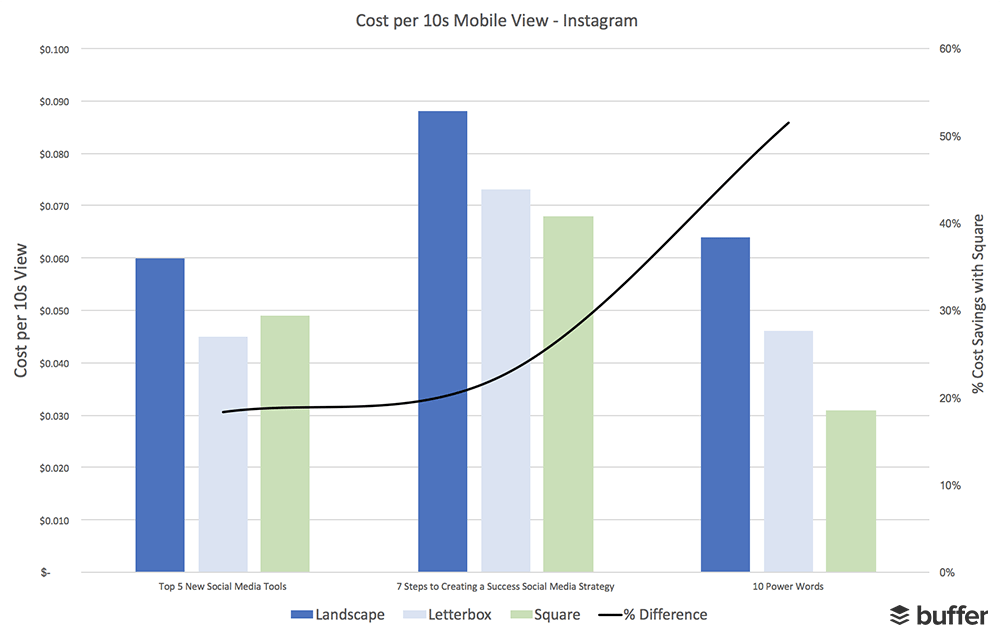
*Quick Note: The cost savings continues upward as users watch more of the video. This is shown below as cost savings using square video increases in every test between 3s and 10s
(Cost Per 10s Mobile Views – Instagram)
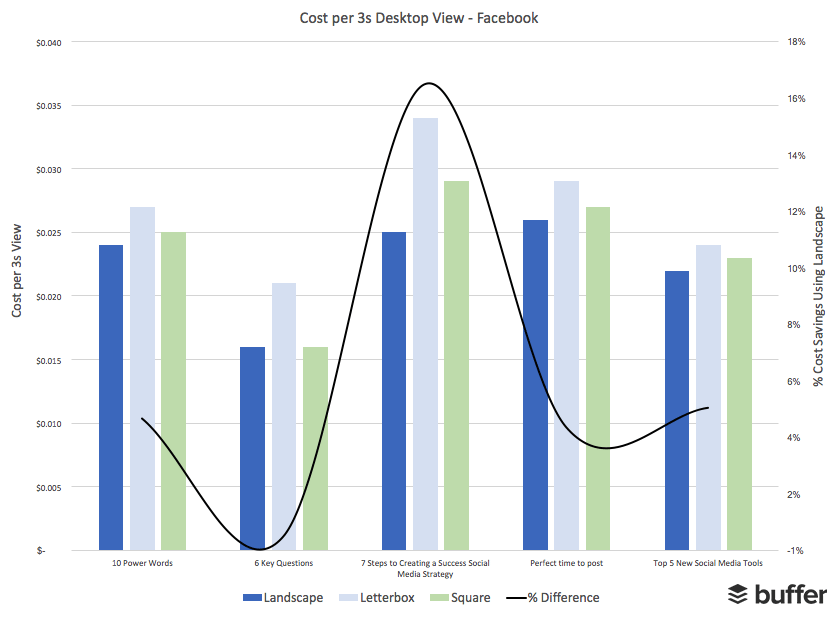
Advertising Takeaway #3: The cost to reach desktop users with landscape video is less than square video
While square video and mobile consumption took the spotlight in this study, there’s another noteworthy data point worth mentioning. That’s the fact that it costs less to reach desktop users with landscape video than it does square video or letterbox video.
(Cost Per 3s Desktop Video View – Facebook)
(Cost Per 10s Desktop Video View – Facebook)
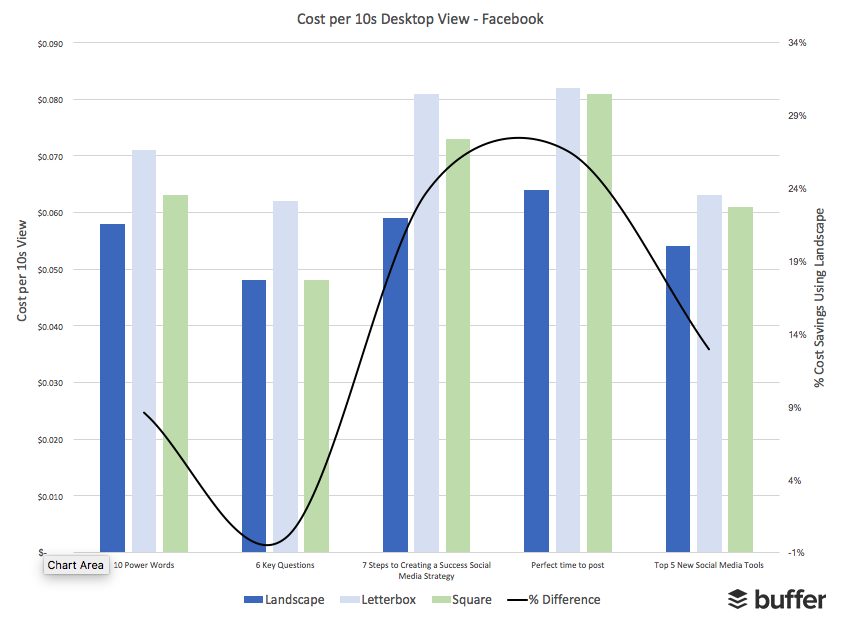
What we found is that the cost to gain a 3s and 10s viewer on desktop is consistently lower by using a landscape video.
*Quick Note: The difference between landscape video on desktop is still not enough to overcome the 2x CPM gain achieved by targeting mobile users.
Key results from the experiments
To help provide some more actionable takeaways from the study we broke up the remaining results into several key categories. These categories focus on important video metrics such as views, completion rate (%), engagement, content, and more. All are listed below (in no particular order) with visuals and insights to boot.
Did we miss anything? We’d love to hear your thoughts or ideas on all of these results in the comments!
Square video vs. Letterbox video vs. Landscape video overview
After all was said and done, both square video and letterbox video (1:1 format) outperformed landscape video when it came to average engagements, views, and completion rate (%) – particularly on mobile devices.
The results here combine the average numbers for both mobile and desktop – we’ll break down how videos perform across mobile and desktop further in a later section.
Average Engagements Per Video Post
The first thing we looked at was how format affected engagements (likes, comments, shares). Square video and letterbox video outperformed landscape on average across all networks.
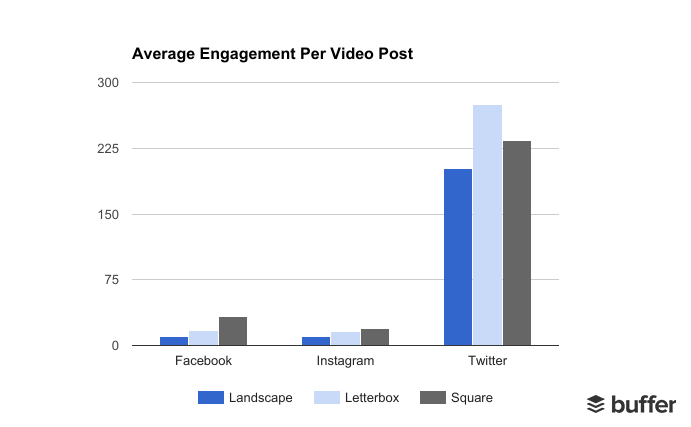
*Quick Note: The Buffer Twitter audience size is significantly larger than Facebook and Instagram, which would help to explain the skewed results towards Twitter above.
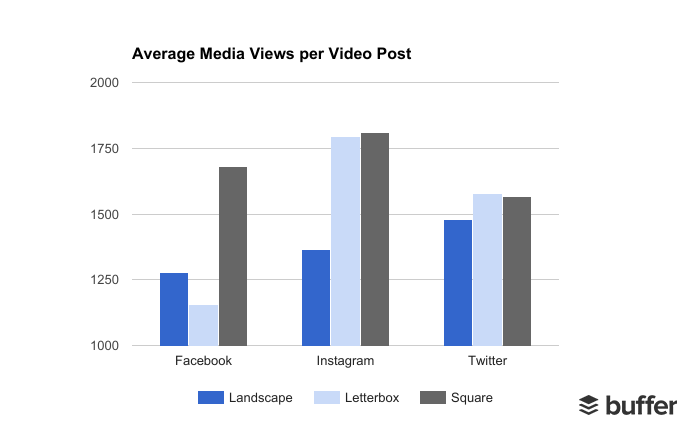
Average Views Per Video Post
Next, we wanted to know how format would affect the overall video views (media views) to each post. Again, square video and letterbox video outperformed landscape video on all platforms.
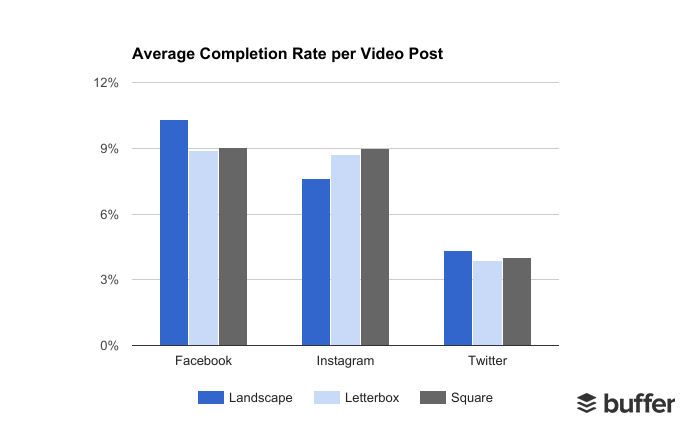
Average Completion Rate (%) Per Video
The last overall data point we looked at was average completion rate (%) per video based on format. This one was particularly interesting due to Facebook’s recent announcement that their algorithm will start to favor “watch time” as an important video metric.
Here’s where the data gets a bit interesting. Landscape video had a higher completion rate on both Facebook and Twitter. We can’t be completely sure what caused this phenomenon, but we’re thinking it had something to do with video “norms” and how people are used to seeing video on social media.
Mobile video vs. Desktop video
After we got an overall picture of how video was performing in various formats on social media, we wanted to dig into what the data looked like with mobile video vs. desktop video. For this data we turned to Facebook Advertising due to the robust audience and device analytics that the platform provides.
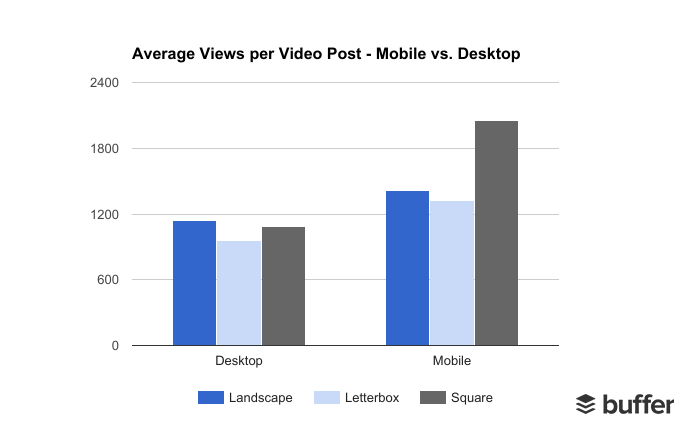
Average Views Per Video (Mobile vs. Desktop)
When it came to views, square video was the clear winner on mobile. However, what we found interesting is that landscape video outperformed both square and letterbox on desktop. We believe that this is because the amount of “real estate” the a video takes up in a person’s feed is less relevant on desktop due to the much larger screen size.
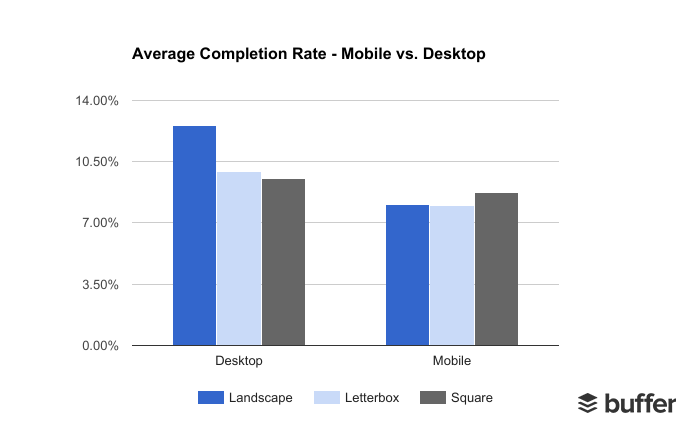
Average Completion Rate Per Video (Mobile vs. Desktop)
Again, square video outperformed landscape on mobile in the completion rate (%) category. But as you can see, landscape video clearly the favorite on desktop.
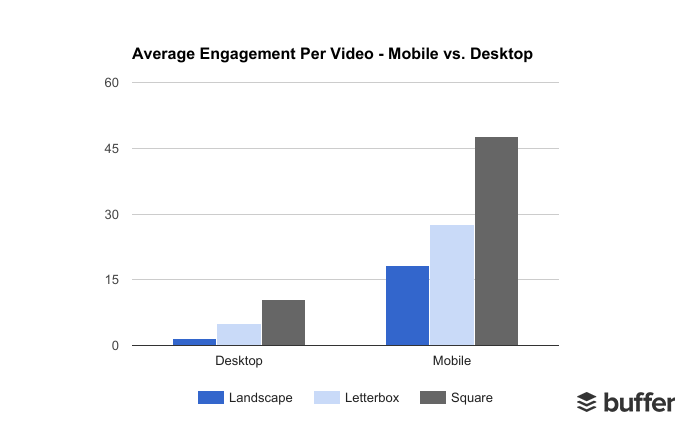
Average Engagement Per Video (Mobile vs. Desktop)
Engagement per video is where the tide starts to swing back in the favor of square video favor on both mobile and desktop. The interesting thing to note here is that while more people watch landscape video on desktop with a higher completion rate, they don’t engage with it as much as they do square video.
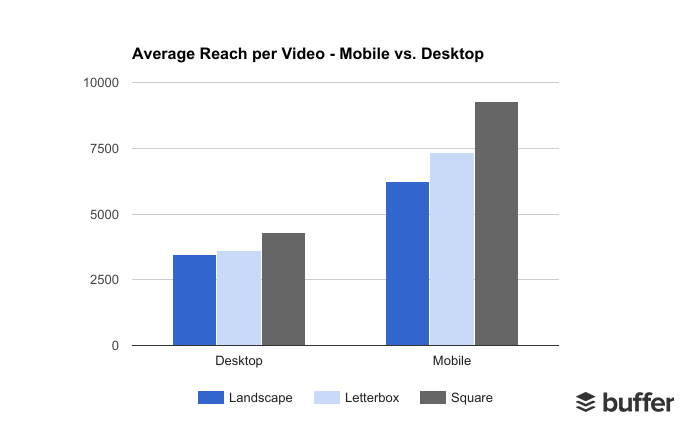
Average Reach Per Video (Mobile vs. Desktop)
By now, you probably could have guessed which format reached more people on mobile vs. desktop! But just in-case, here’s how each performed in terms of average reach per video.
3 additional video learnings
Learning #1: Text-only videos vs. talking-head videos
One of the side studies we ran after completing the bulk of our main experiments was to test video “type.” We grouped these into two buckets: text-only vs. talking-head (see above for full examples). Here’s how they performed:
(Average Video Completions: Talking-Head vs. Text-Only)
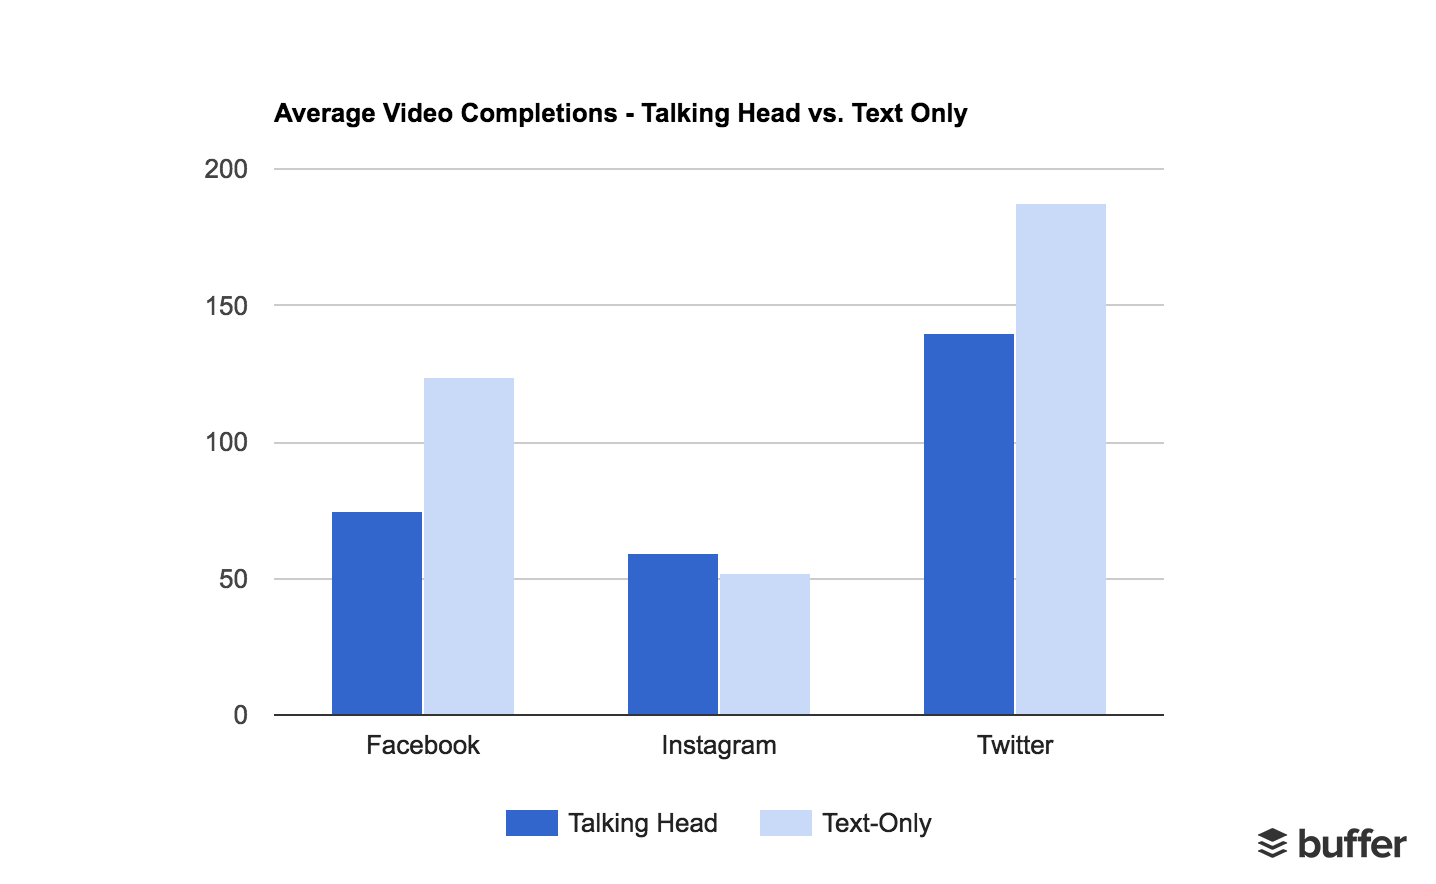
Takeaway: Text-only videos performed better on both Facebook and Twitter. Creating informative, easily digestible videos for these platforms will help to increase your completion rate.
(Average Engagements – Mobile vs. Desktop: Talking-Head vs. Text-Only)
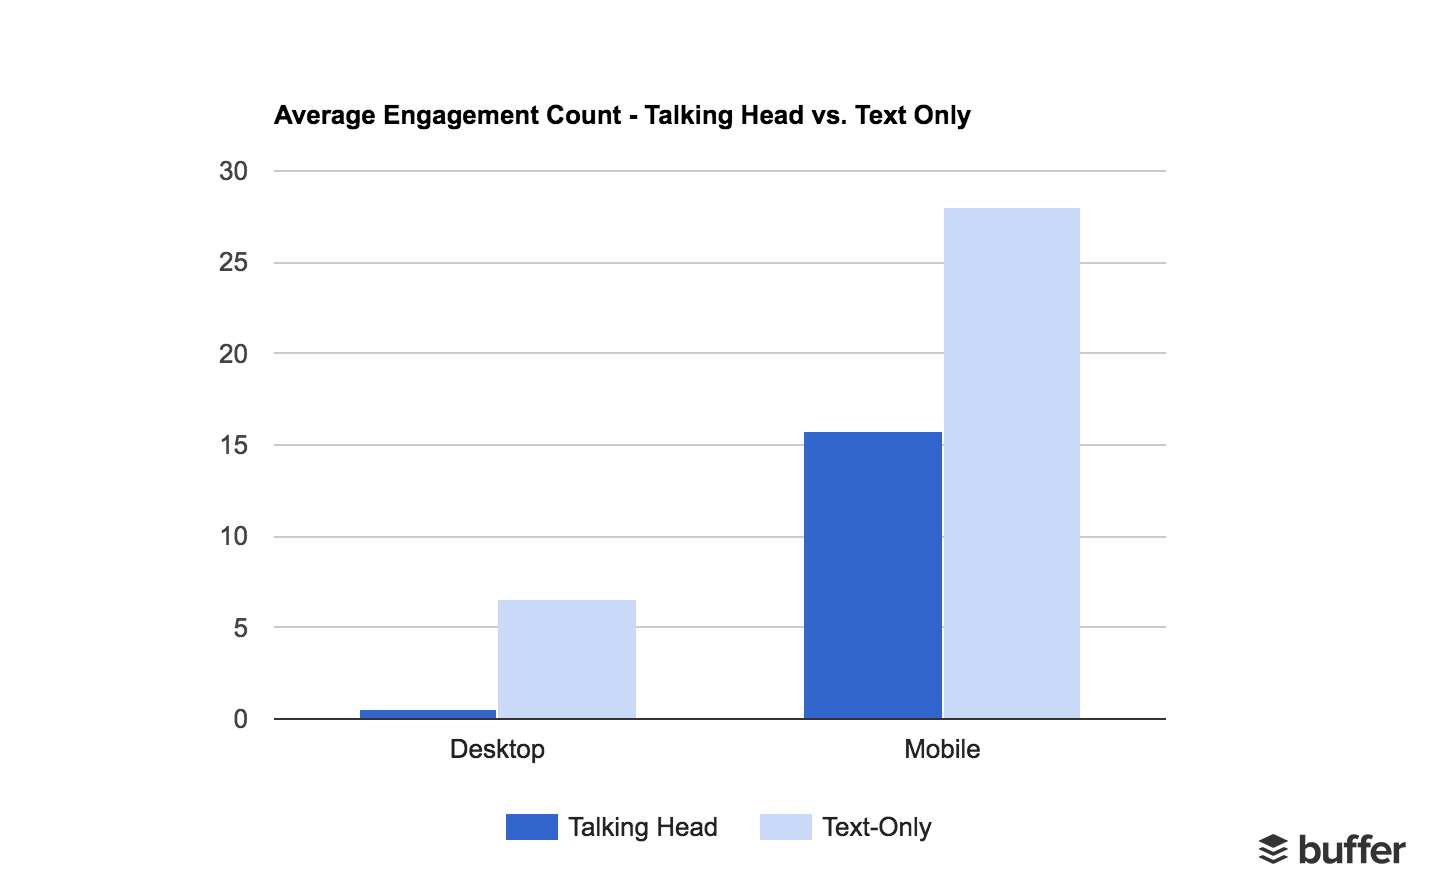
Takeaway: The nature of mobile content consumption seems to favor both talking head and text-only videos. Experimenting with both formats via mobile targeting is a great way to find out what your audience likes.
Learning #2: Opening image and 3s total views
The next thing we tested was the effect that the opening image or “cover image” had on overall watch time of a video. For these tests, we grouped the opening images into three different categories: image + text, text-only, video + text.
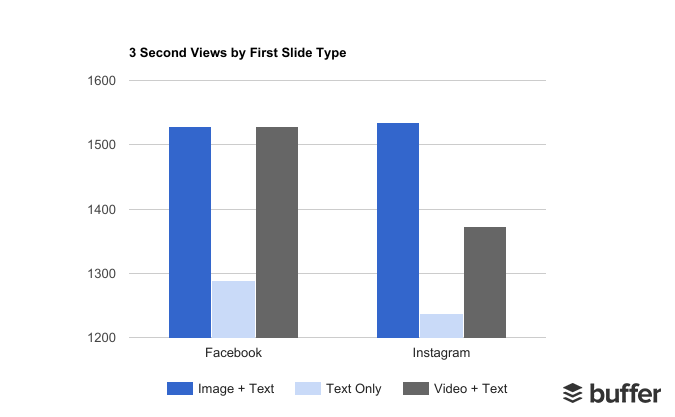
Takeaway: The best way to increase viewership on your videos is to include either a video or an image along with descriptive text. Text-only intros dramatically decrease views to your video.
Learning #3: Length of video and engagement
Last, but not least, we answered the question: Do we see a significant drop off in engagement rates as the video length increases? We tested videos at 30-seconds, 60-seconds, and 90-seconds. There were some interesting learnings here!
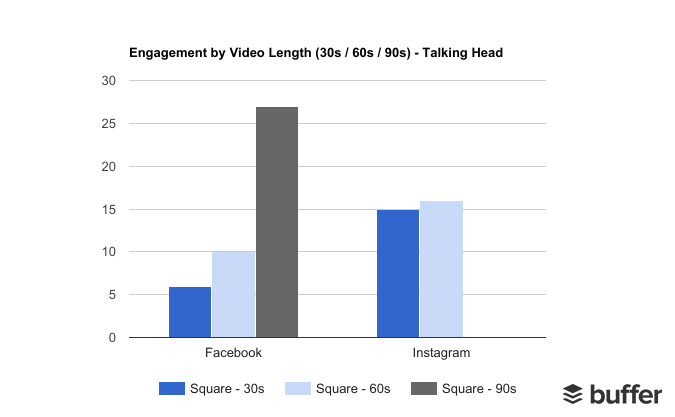
Takeaway: The results showed that the longer the video, the more engagement it got. It’s important for marketers to experiment with several timing variations to figure out what their audience engages with most.
*Quick Note: Instagram advertising allows for a maximum of 60-second videos which is why we weren’t able to test 90-second videos above.
Overall conclusion: Square video and mobile optimization are key for marketers
Video content is now widely accepted to be the best way to reach your audience. At the same time, social media content consumption is moving almost exclusively to mobile. Given this dramatic shift from desktop to mobile, businesses can thrive in 2017 and beyond by posting video content optimized for the mobile user.
One great way to optimize for the mobile user is through the creation and distribution of square video (1:1). As shown in this study, square and letterbox format outperformed landscape in just about every test we ran. With mobile news feed space at a premium, the more real estate on a user’s screen your content occupies, the better.
From a marketing standpoint, we’d recommend that you begin to experiment with creating square video for social media. To do so, you can use a product like Animoto. Animoto is a cloud-based, drag-and-drop solution, great for everyday marketing videos – and you don’t have to be a true video marketing professional to use it.
There’s also more complex products out there like Adobe Premier/After Effects to help transform your landscape-style clips into square videos. Though, the learning curve is a bit steeper with these two products.
Our teams at Animoto and Buffer are excited to expand on the learnings from this study. We believe that the trend of mobile content consumption and square video on social media has only just begun. It’s only a matter of time before marketers and brands catch on.
The results from these experiments also have huge implications for not only organic posting on social media, but for advertising and mobile video consumption as well. Simple tweaks to the way that marketers approach video creation will help to maximize the results across platforms.
We’d love to hear from you! What are your thoughts on the results from this study?
Please feel free to leave us ideas, thoughts, or suggestions in the comments below. Our teams would be thrilled to continue the conversation!
Try Buffer for free
140,000+ small businesses like yours use Buffer to build their brand on social media every month
Get started nowRelated Articles
Learn how Akta, the creator at Passionfroot, uses Buffer to streamline her content scheduling process and grow Passionfroot's following on Instagram and LinkedIn.

Dave grew his traffic newsletter by 2.5x using one simple (and fast) tactic. Here’s how.

Learn how Tempt built a small marketing agency and how they manage multiple clients using Buffer.