


We’ve just launched out 2019 State of Social report: Check out the latest social media data, and learnings here.
What’s in store for the social media industry in 2018?
The way consumers use social media channels is constantly evolving and as marketers and entrepreneurs, we need to adapt to these changes.
To better understand these changes, plus what’s ahead for 2018 and beyond we teamed up with Social Media Week to collect data from over 1,700 marketers and create the State of Social Media 2018 report. The report shows us how marketers, from businesses of all sizes, are approaching social media marketing.
Ready to jump in?
![]()
A handy guide to navigating what’s coming up next in the social media world.
Contents:
3 Key social media takeaways to guide your marketing in 2018
1. There are huge opportunities in the messaging space (only 20 percent of marketers have used messaging apps for marketing)
Messaging platforms have grown at an incredible rate over the last couple of years. And there are now more people using the top four social messaging apps (WhatsApp, Messenger, WeChat, and Viber) than the top four social media apps (Facebook, Instagram, Twitter, and LinkedIn)
36.
Despite this incredible growth, our State of Social 2018 survey found that just 20 percent of businesses have invested in marketing through messenger platforms:
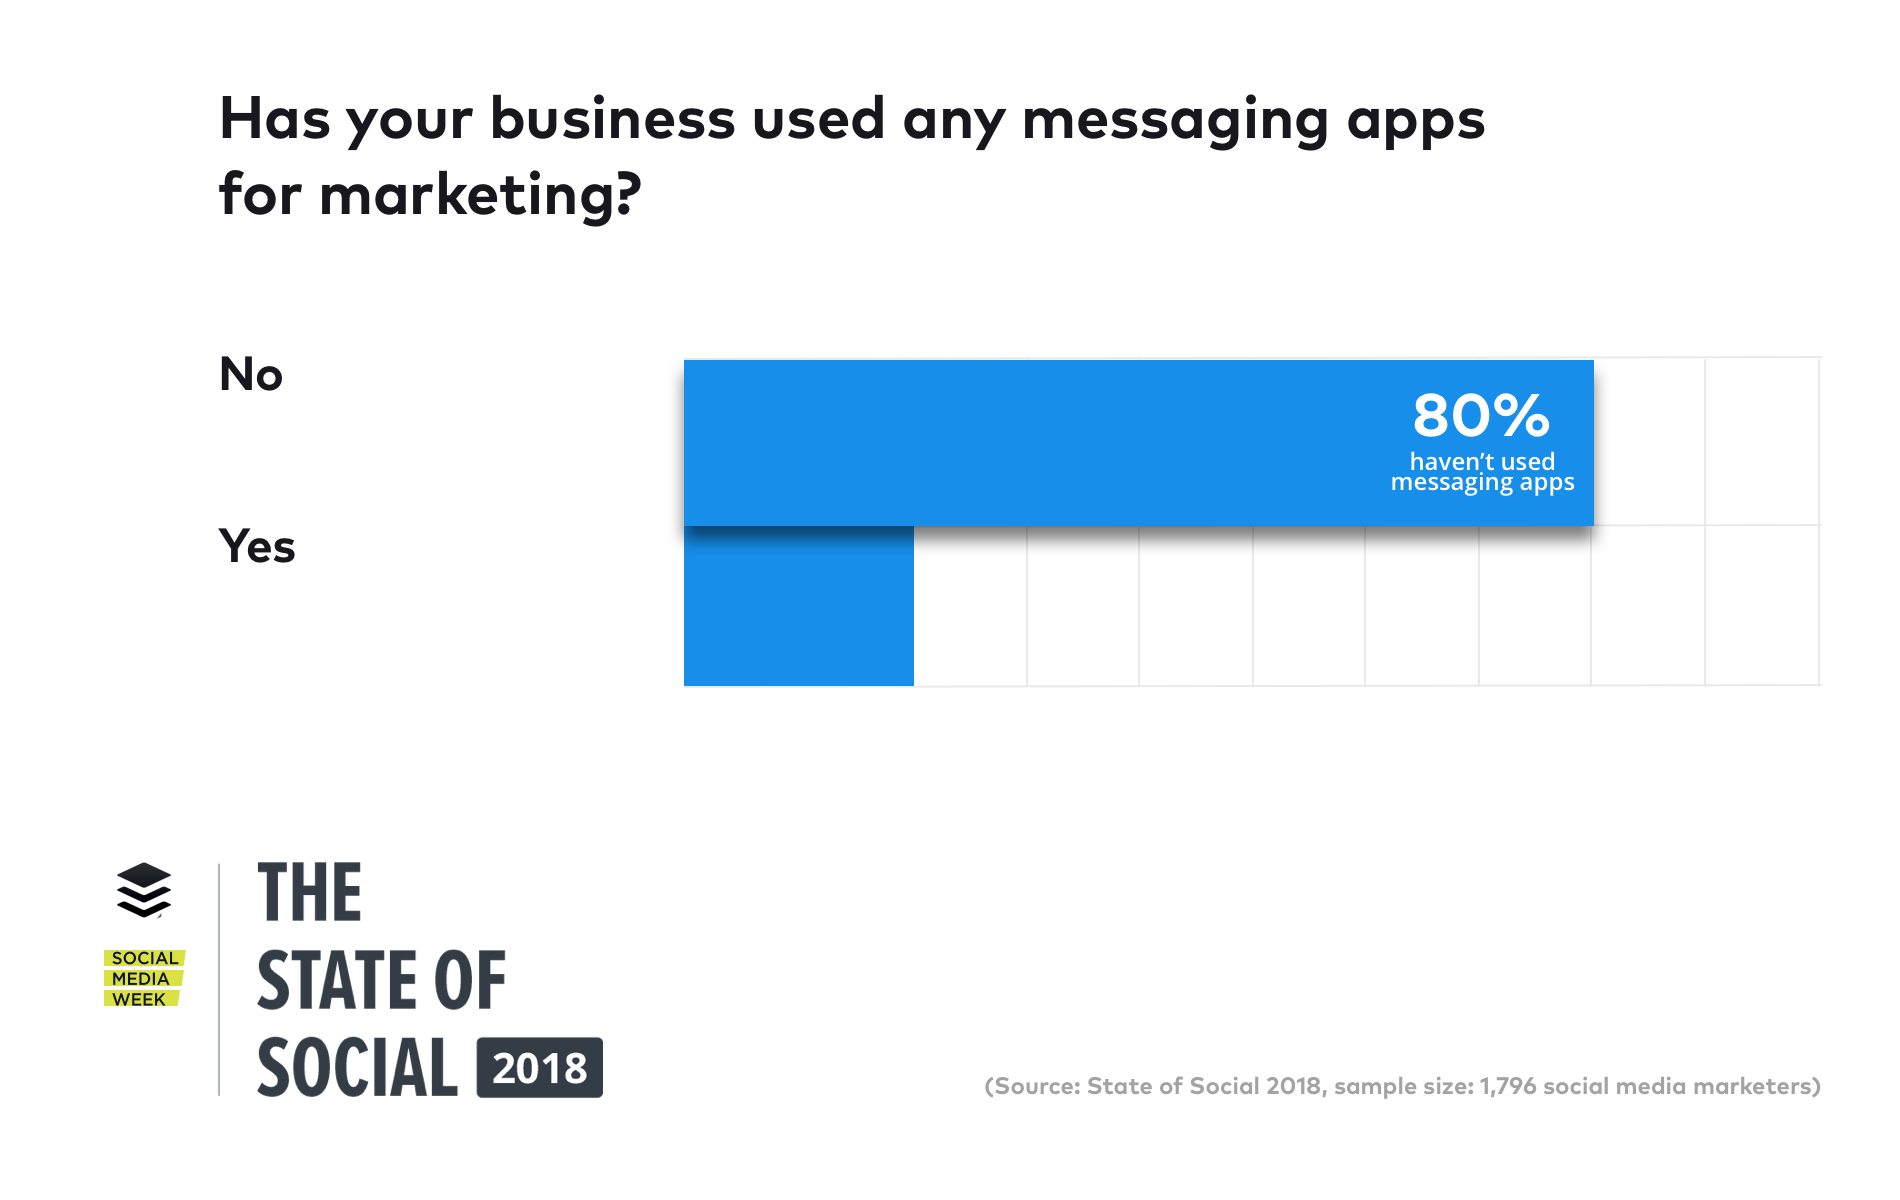
After seeing such high user growth for the past few years, companies like Facebook will begin to focus on how they can monetize chat apps which will open up new advertising opportunities for marketers.
Right now, marketers still appear to be investing more time and resources into social media platforms like Facebook and Twitter, but as organic reach continues to decline (more on this below), we’ll see a greater number of marketers experiment with messaging apps as a way to connect with their audience.
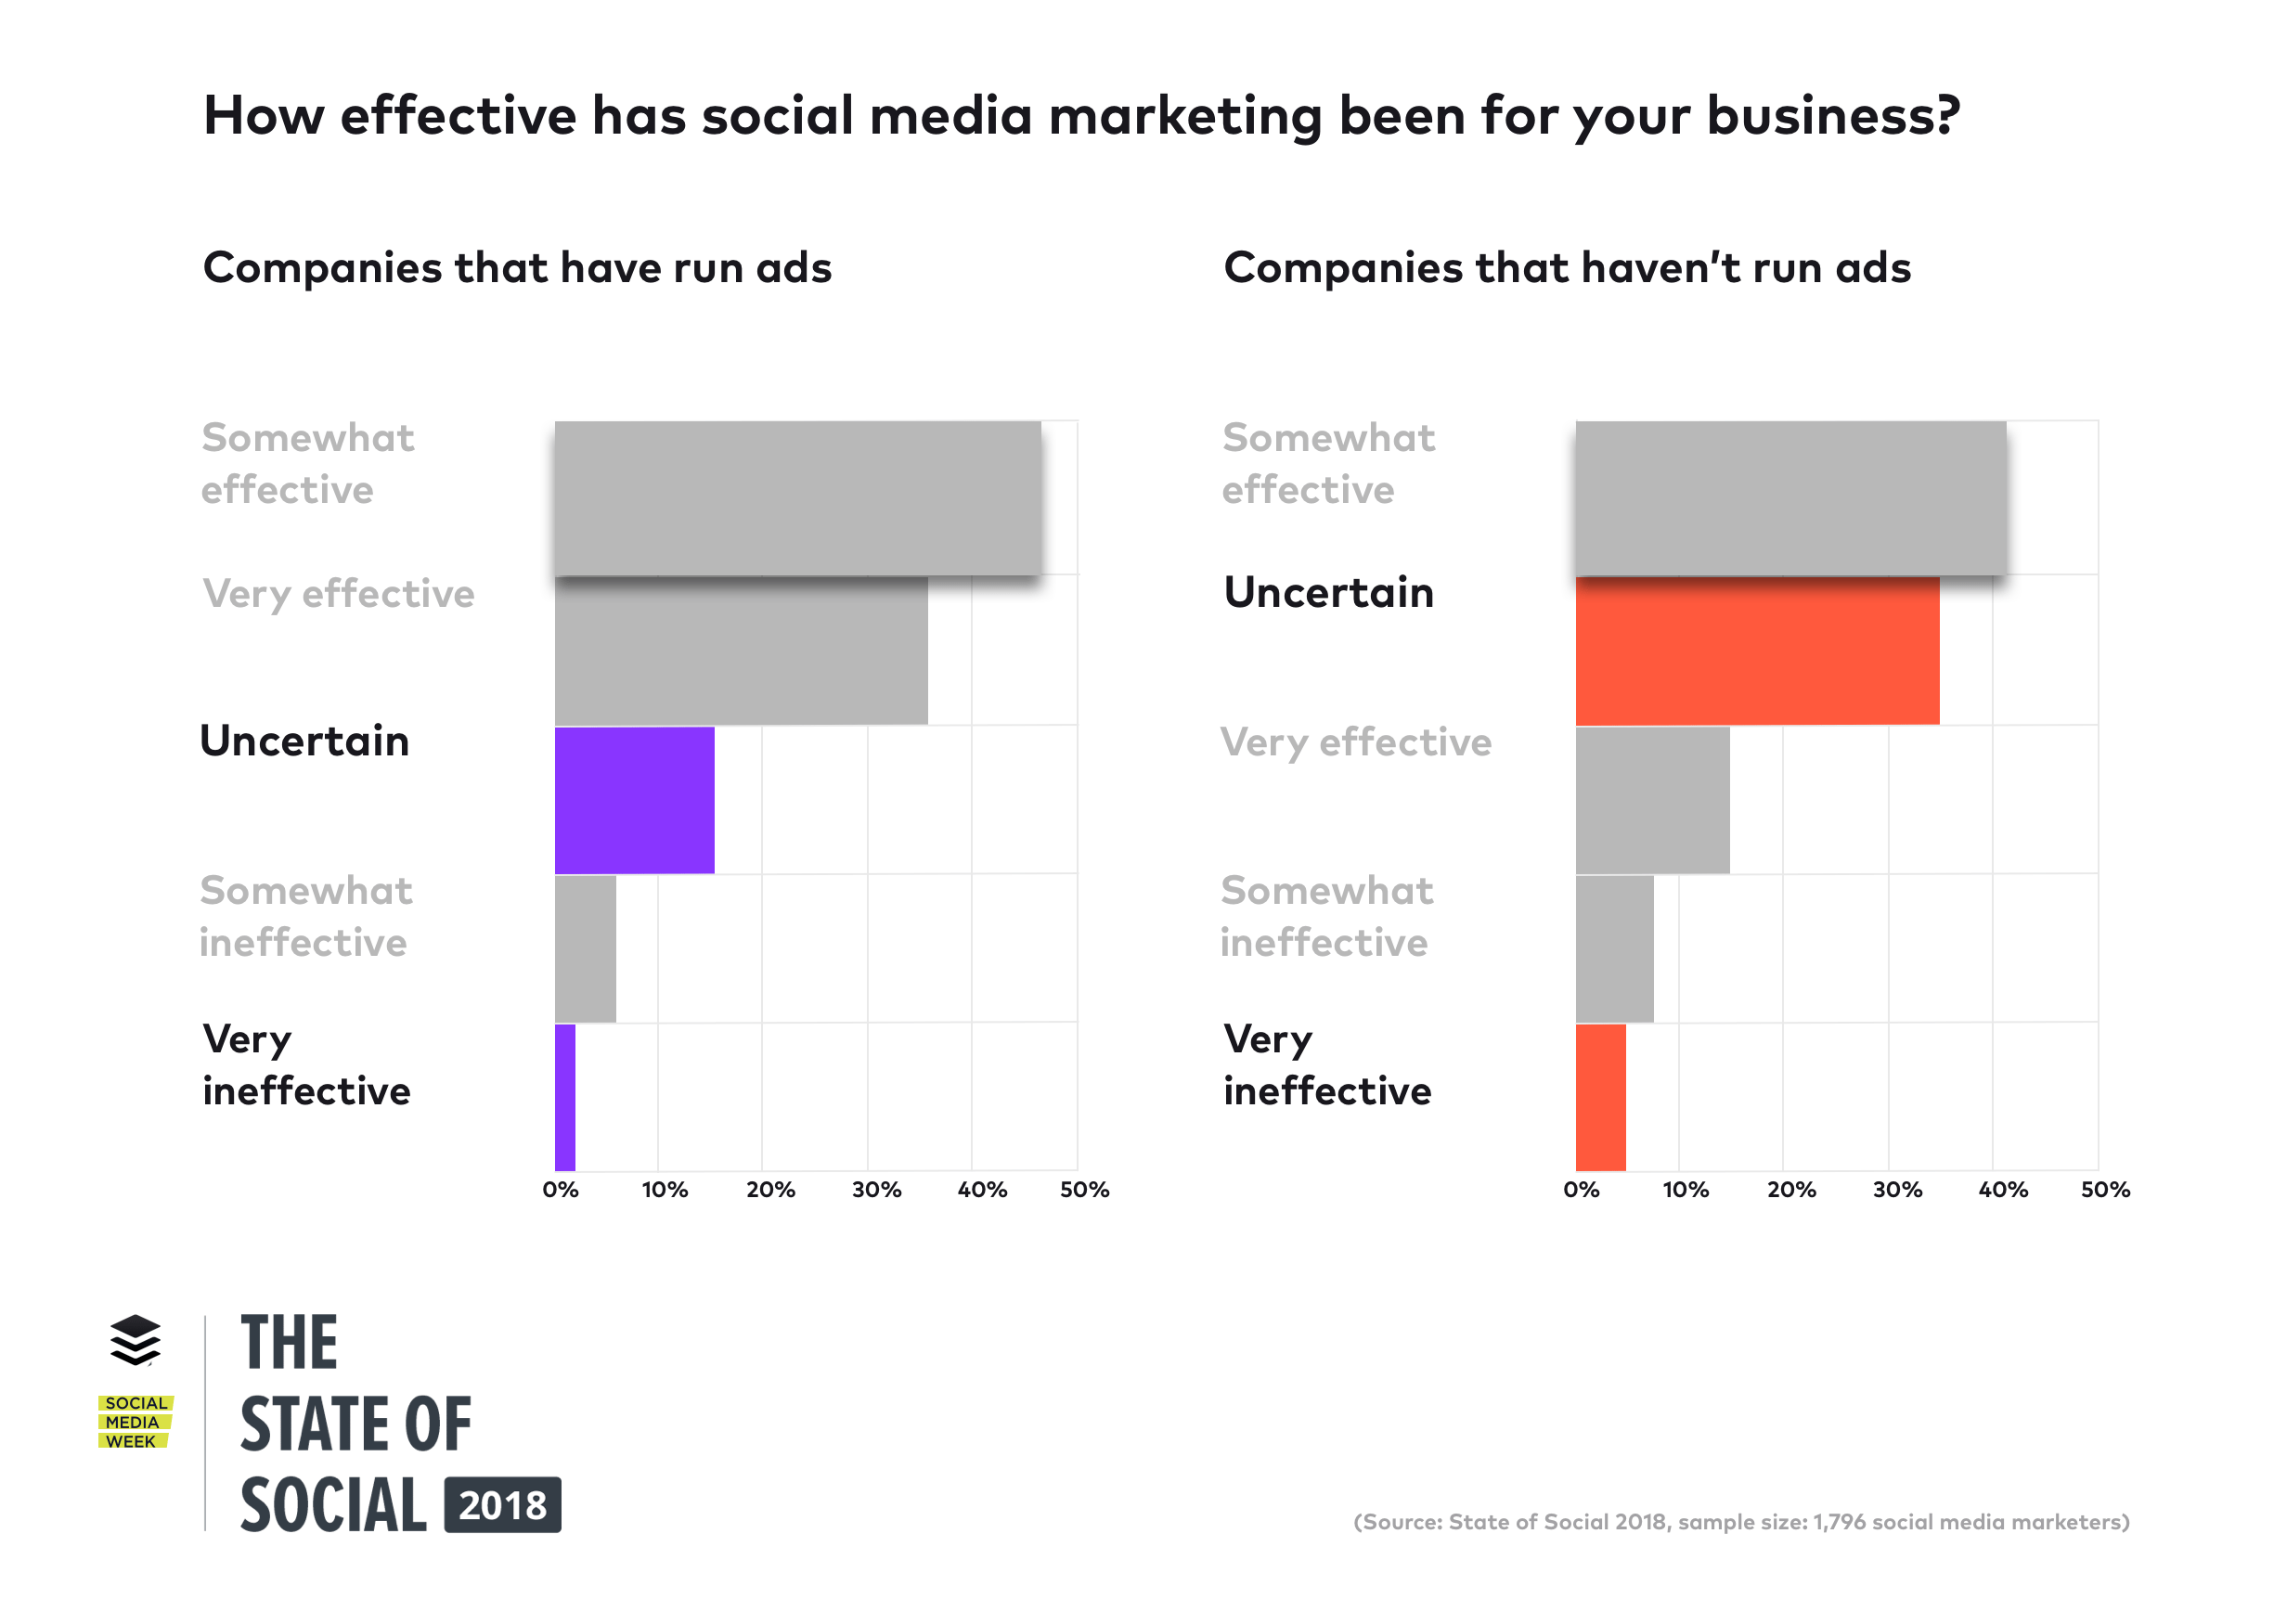
2. Companies that invest in social media ads are more than twice as likely to say social media marketing is “very effective” for their business
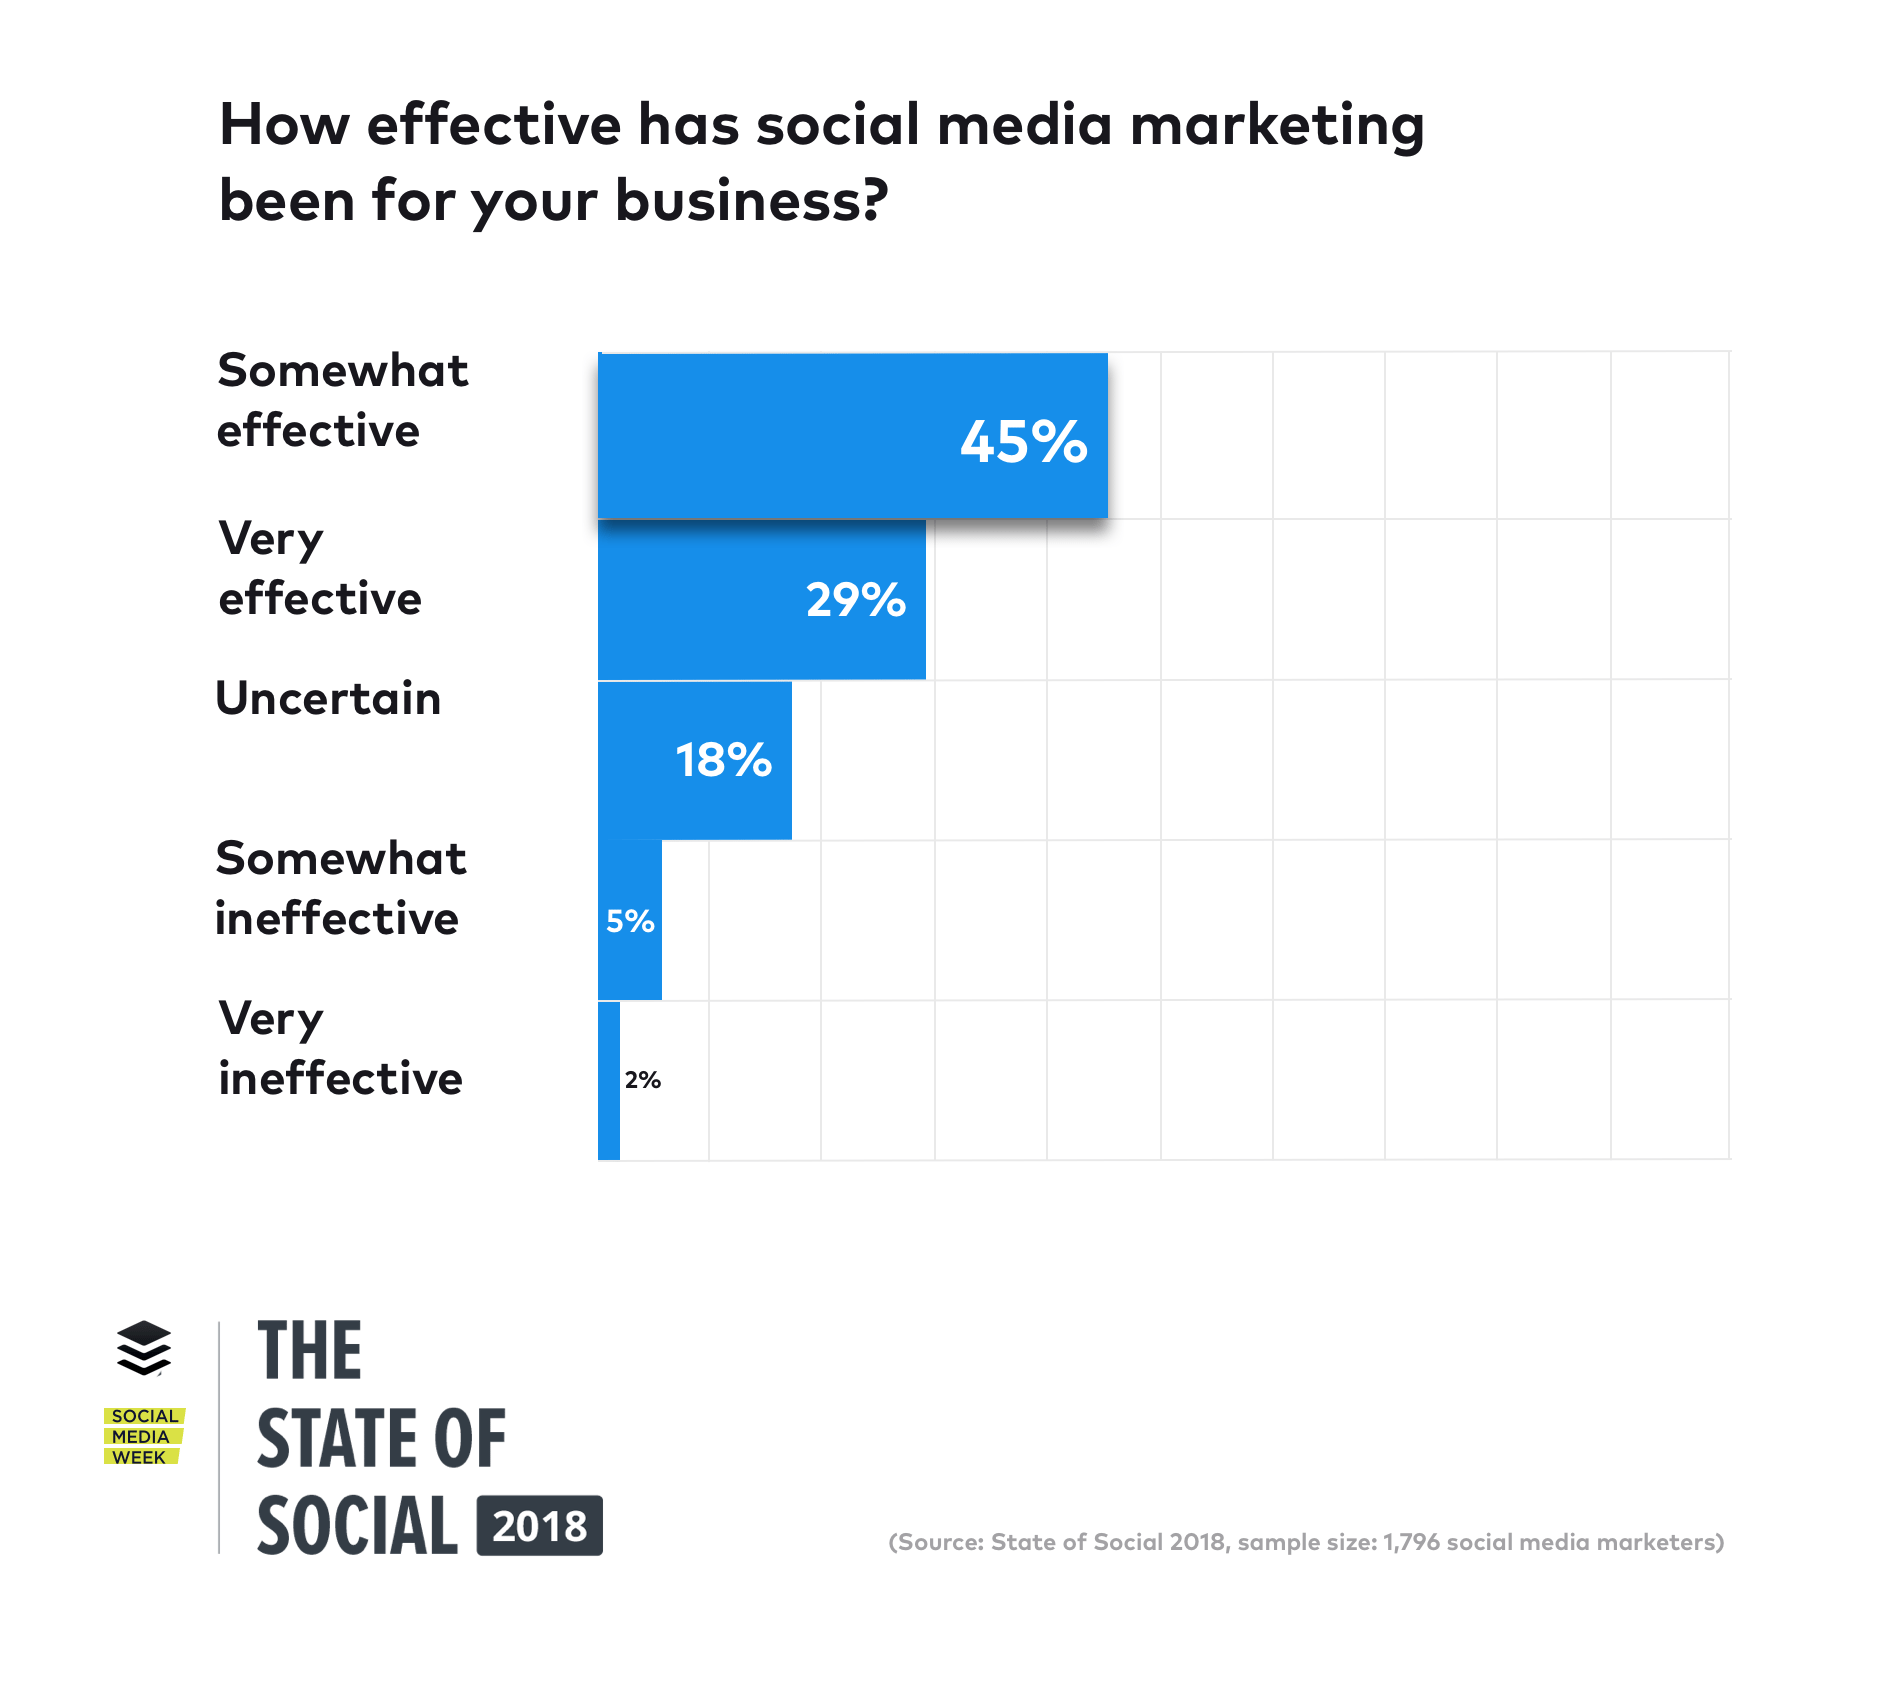
When we asked respondents how effective social media marketing has been for their business 45 percent said “somewhat effective” and a further 29 percent believed that social media marketing had been “very effective”.
However, when we split these results based on whether or not the respondents had invested in ads, we found that businesses that have invested in social media ads are more than twice as likely to report that social media marketing is “very effective”.
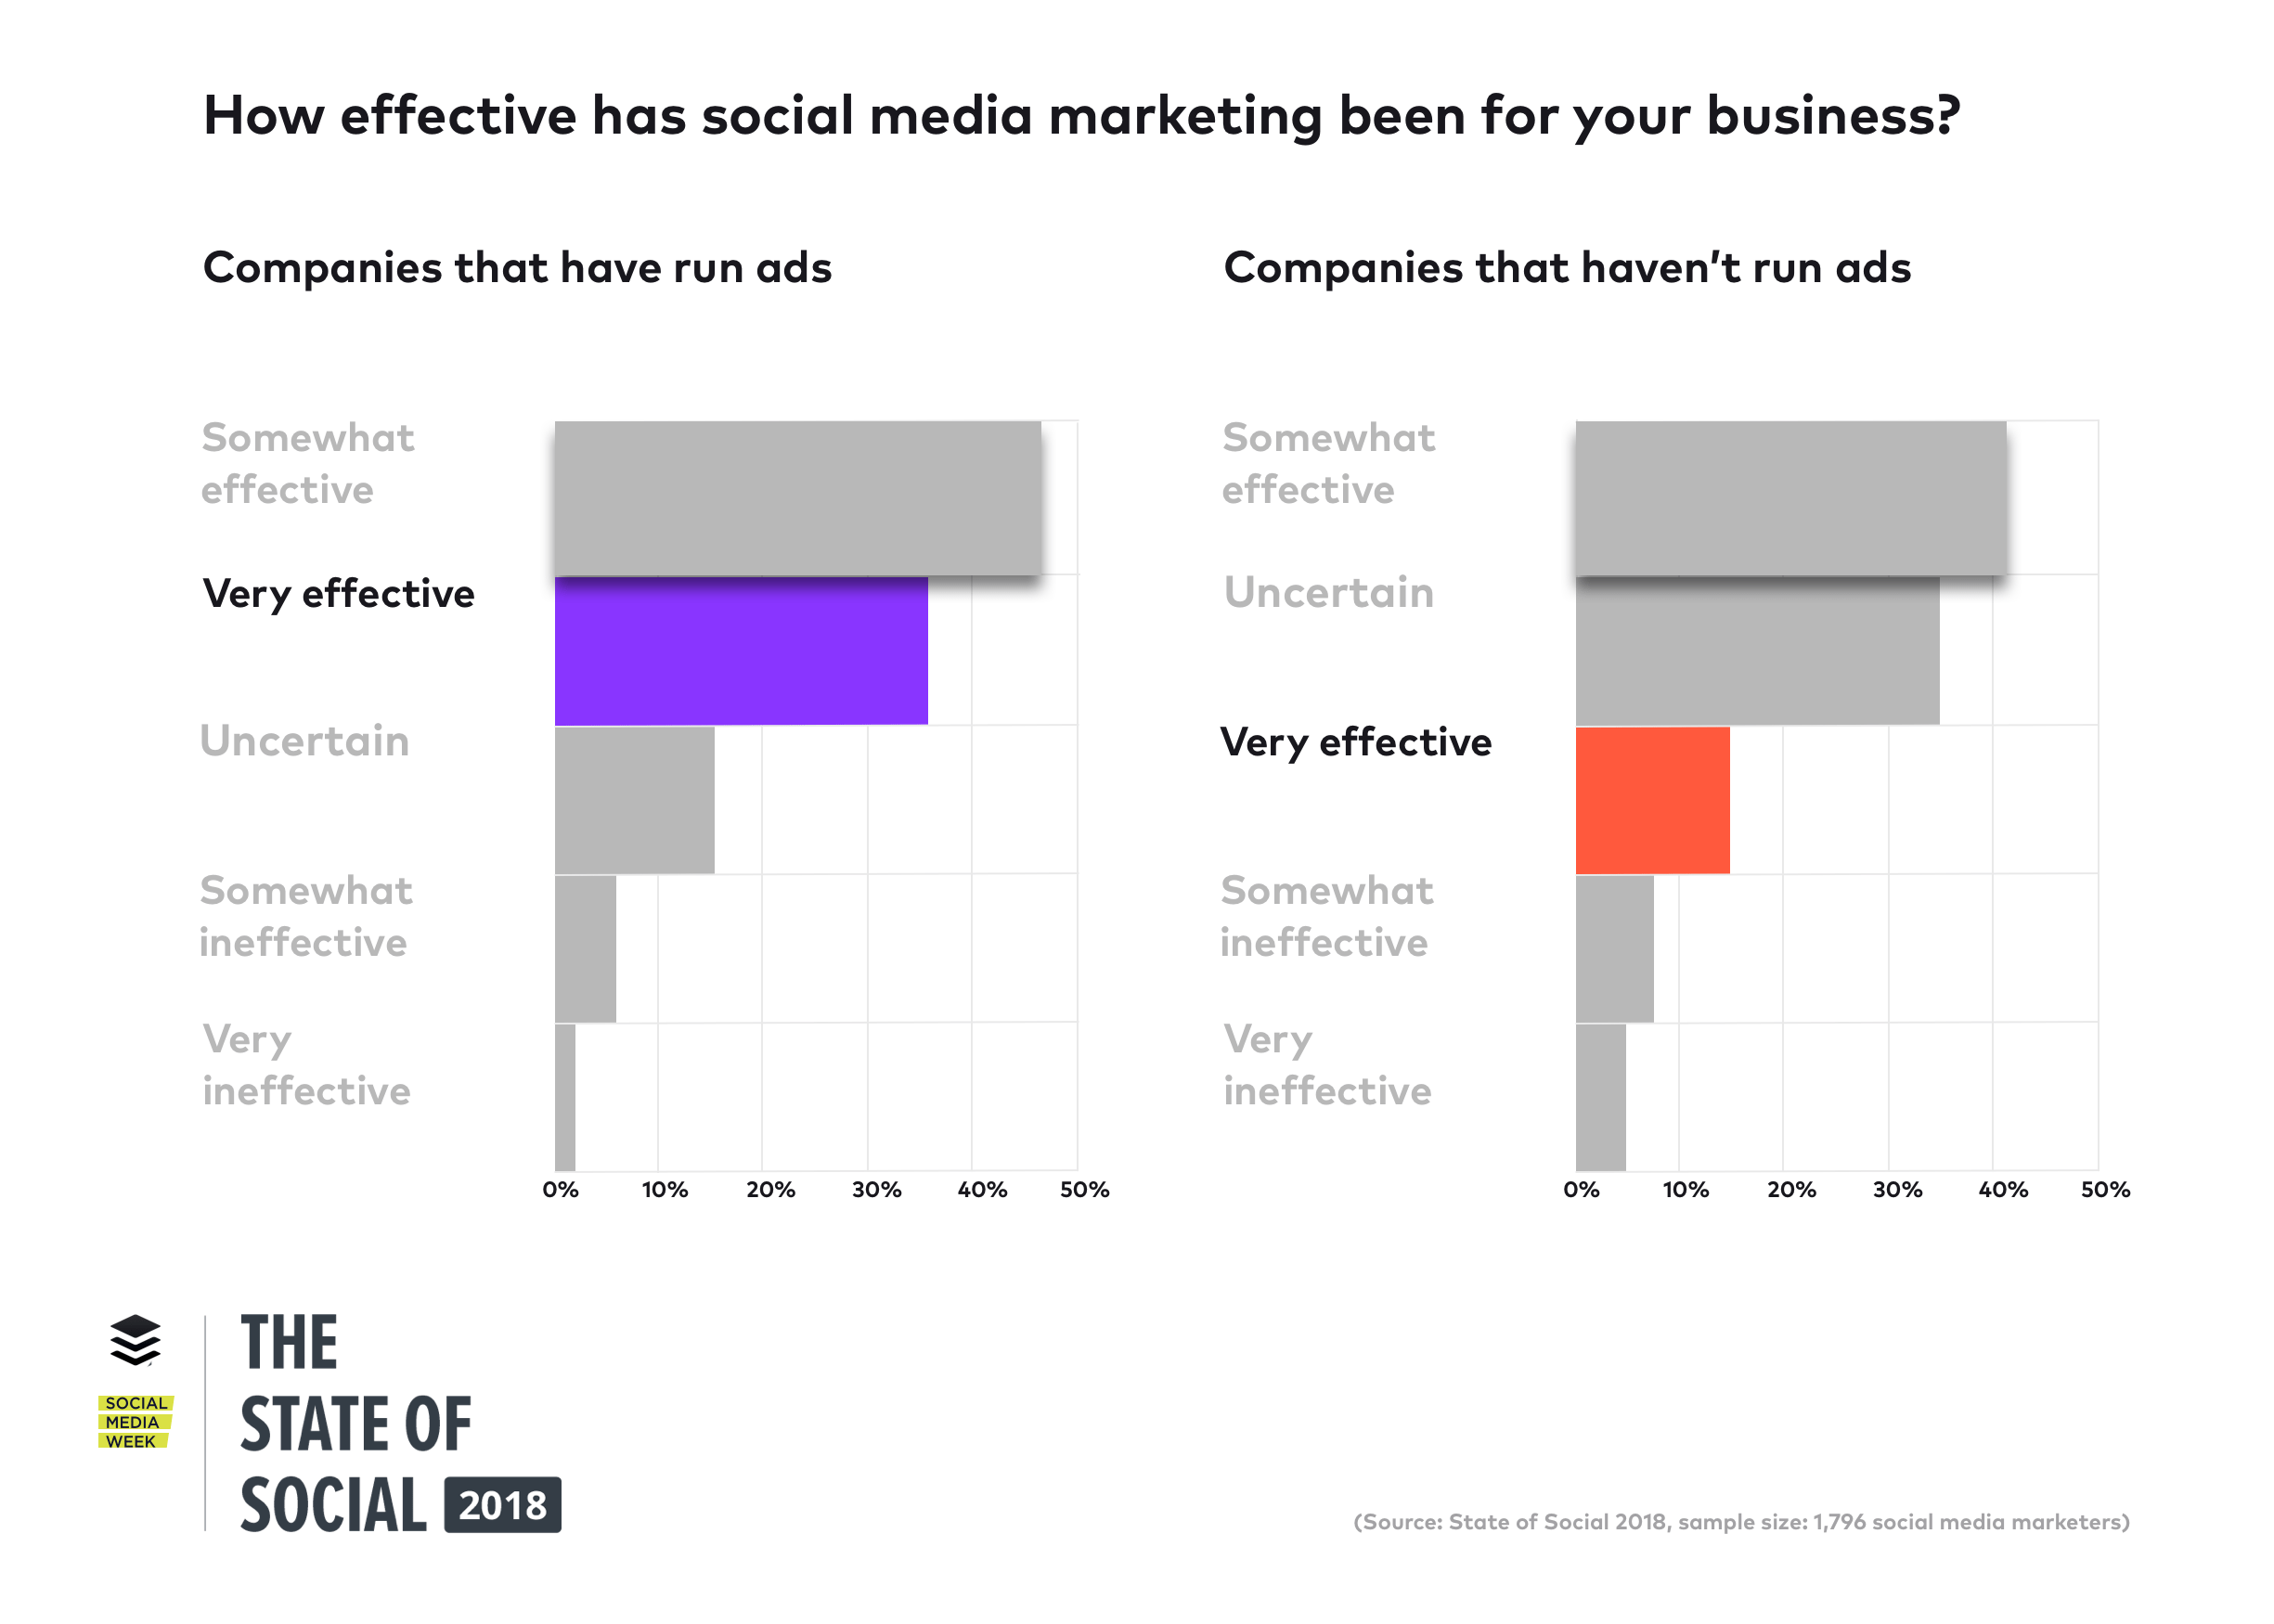
Whereas businesses that have not invested in ads are more than twice as likely to report that the effectiveness of social media marketing for their business is “uncertain” or “very ineffective”.
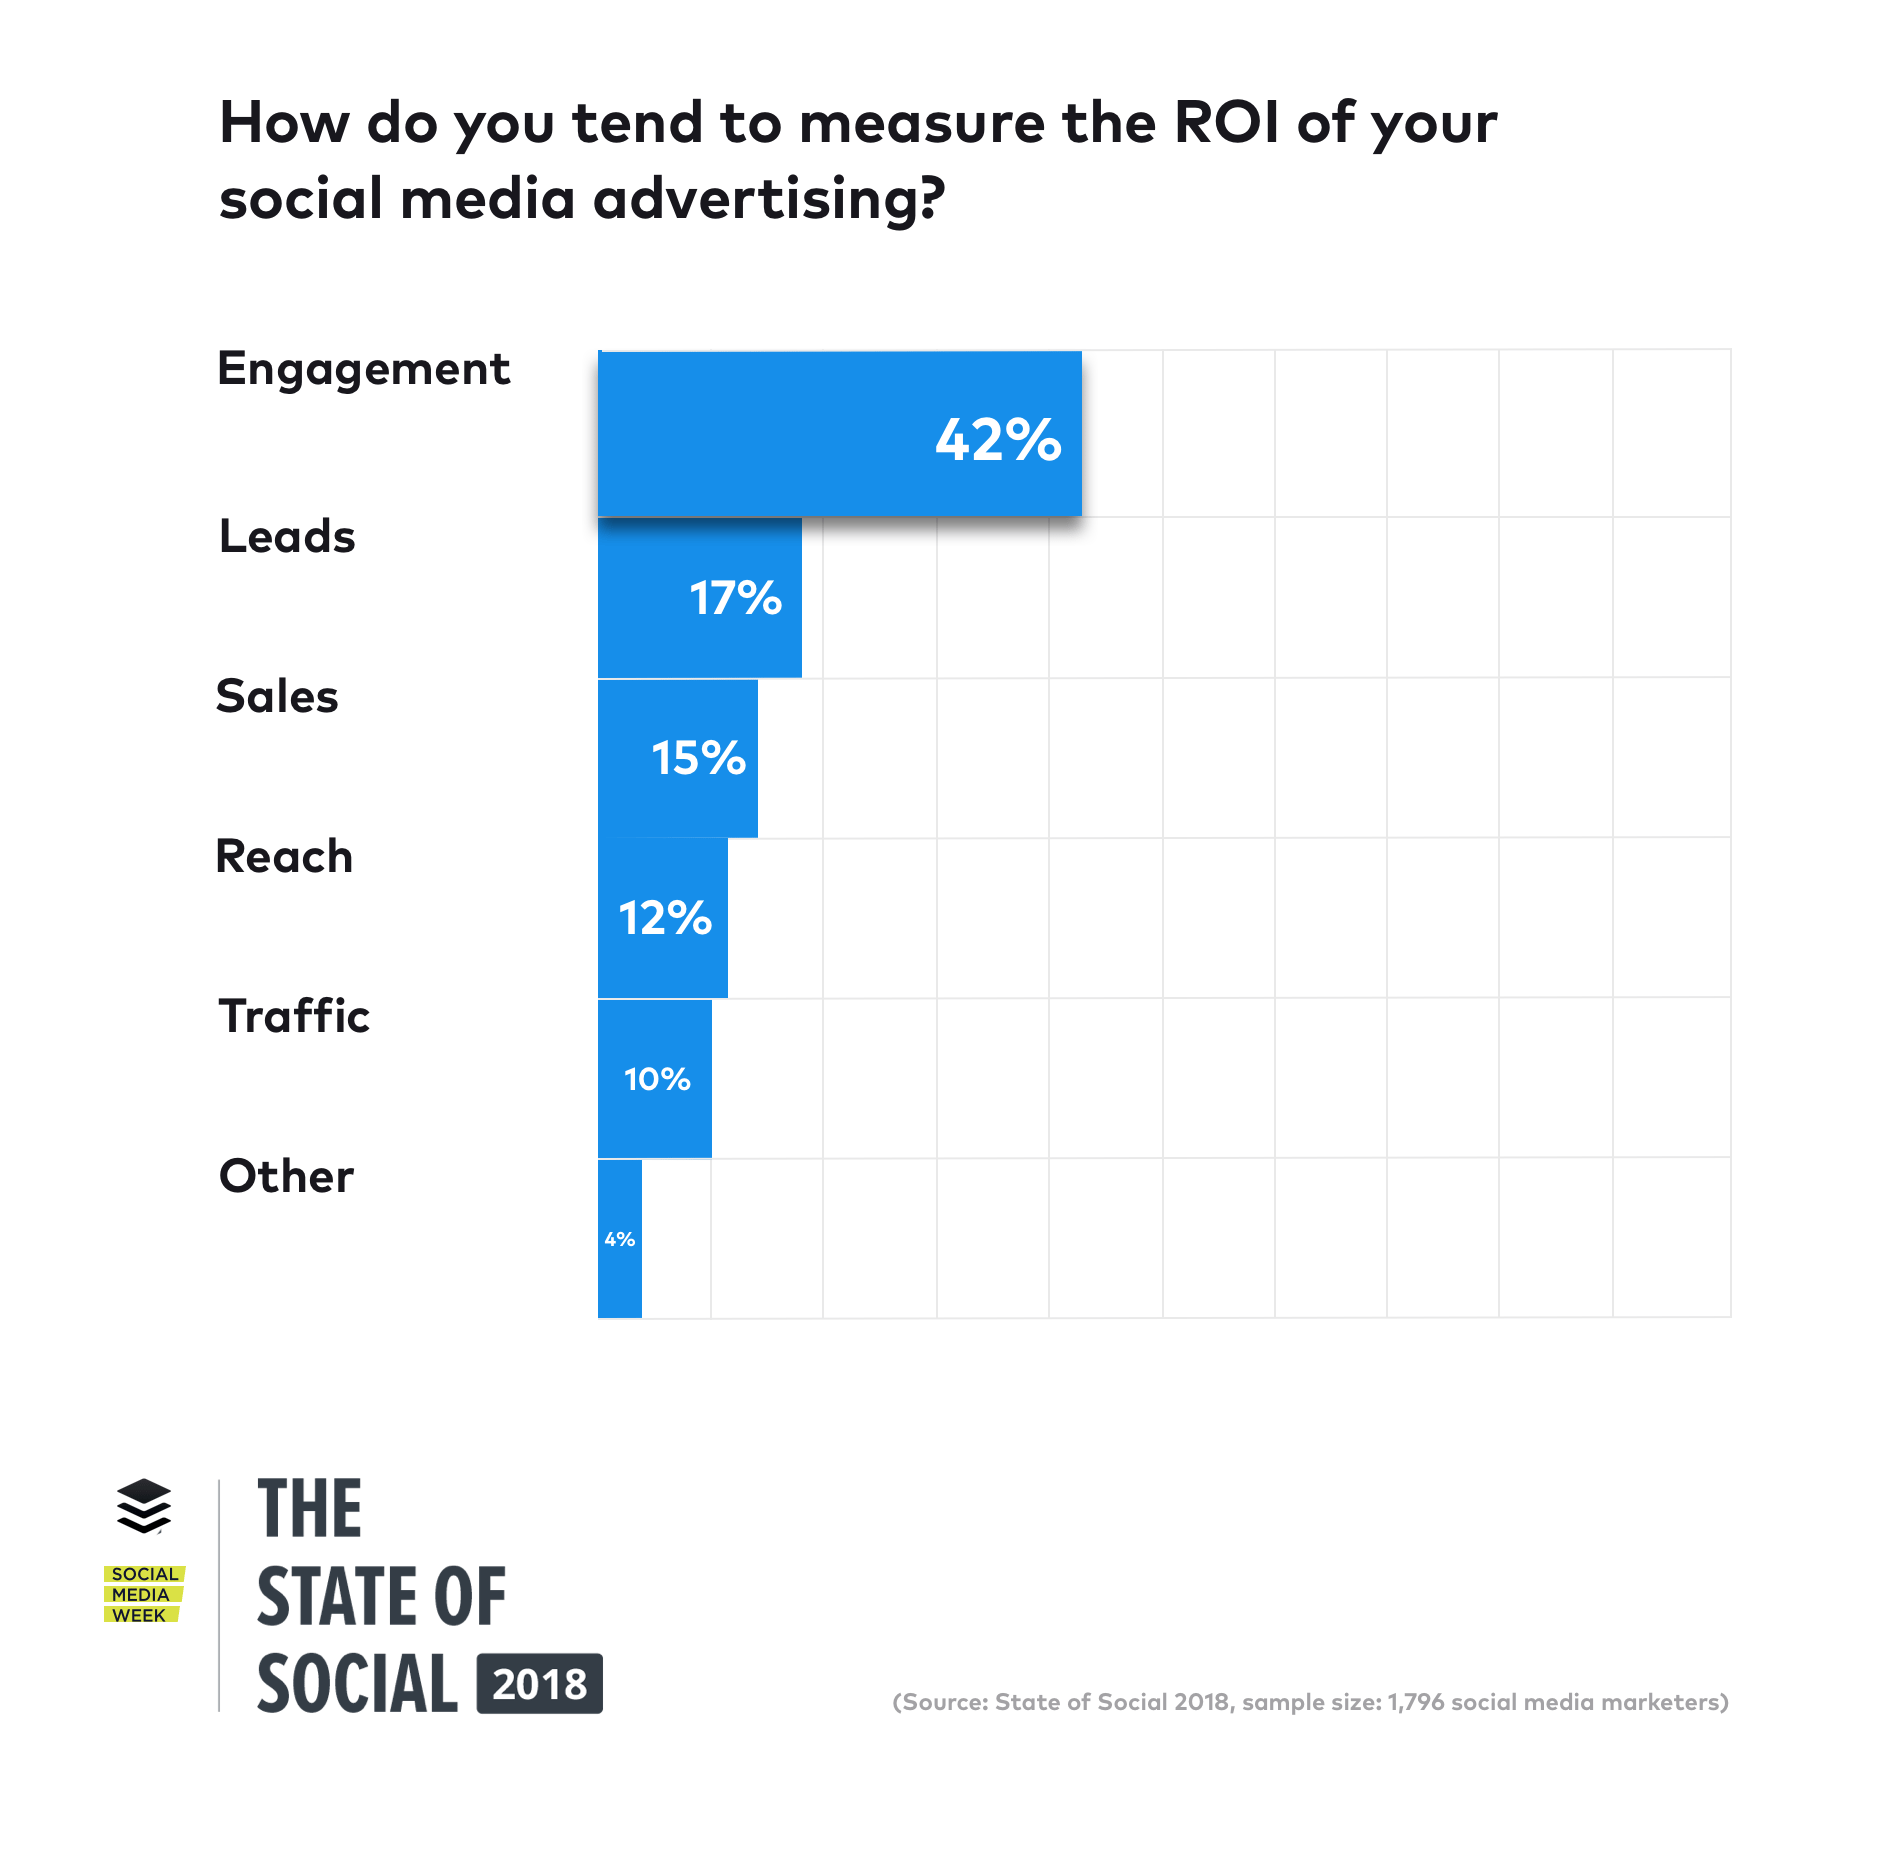
3. Engagement is the #1 way to measure ROI from social media advertising
When we asked respondents how they measure the ROI of their social media advertising campaigns, 42 percent said engagement, followed by leads (17 percent) and sales (15 percent):
When we broke down the data by business size, engagement was still the #1 way both small and large businesses measure ROI from social media advertising:
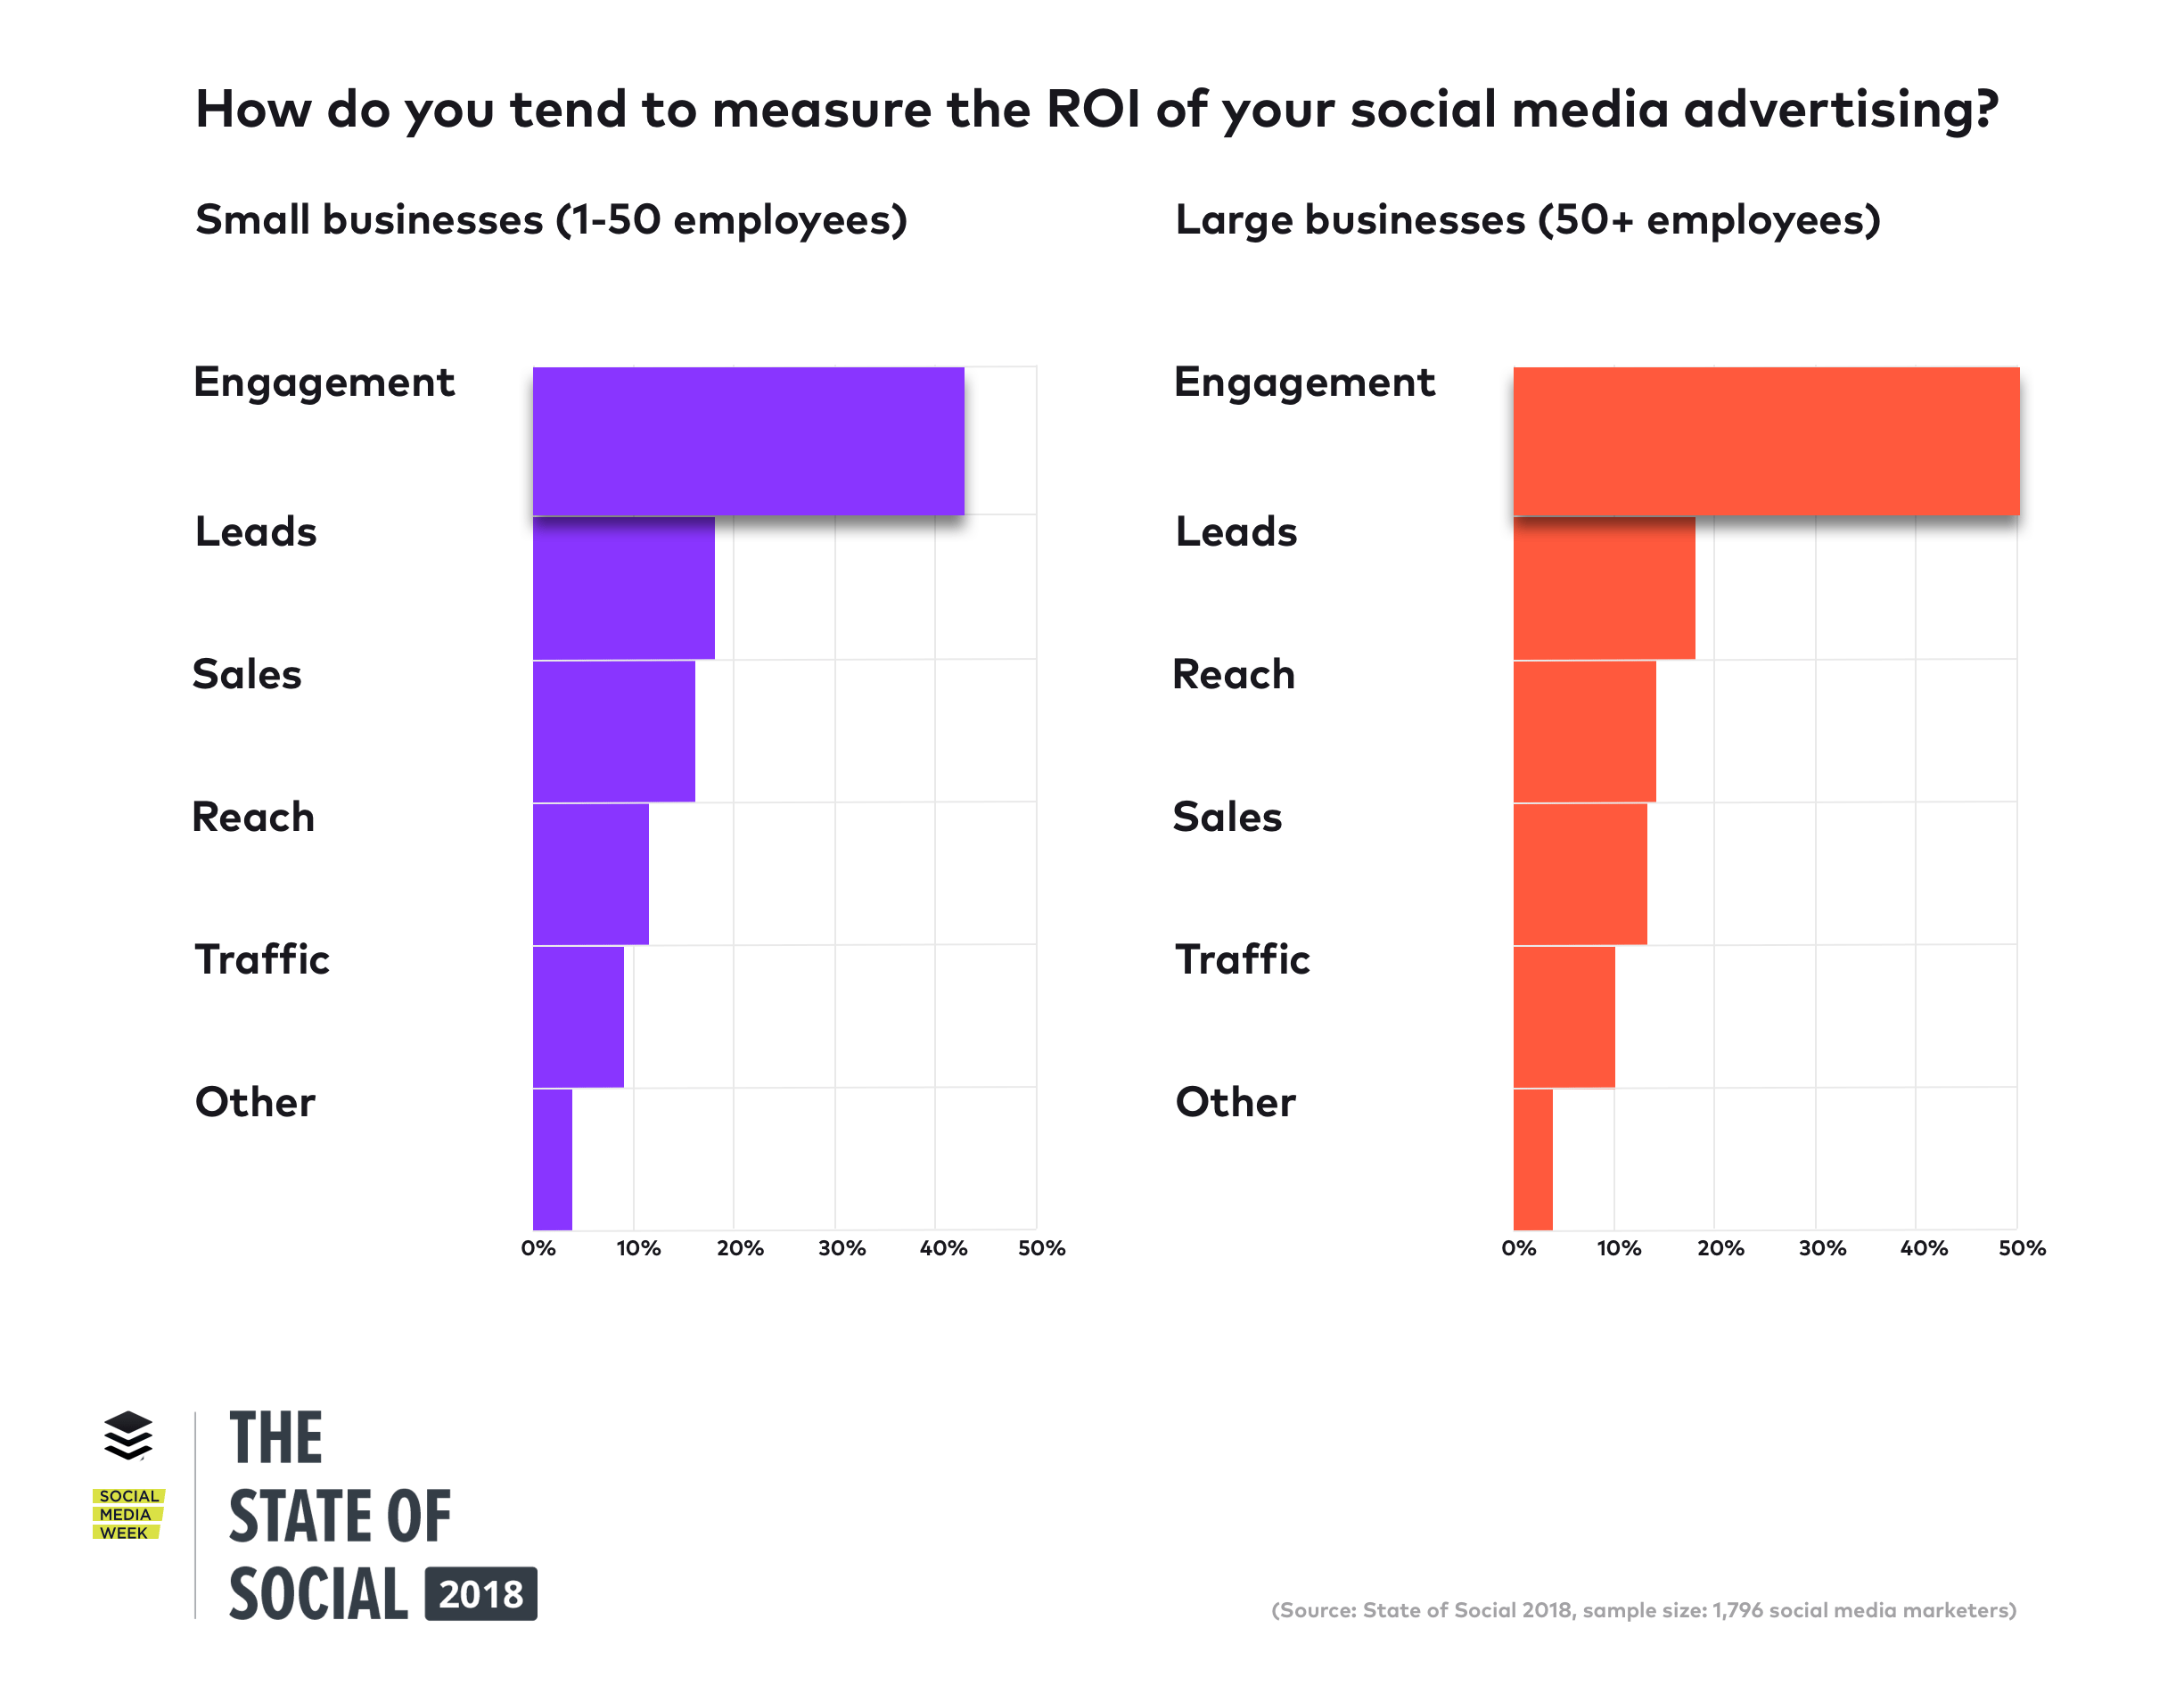
This appears to be the continuation of a trend we noted in 2017, where social media is becoming more about engagement than driving traffic or making direct sales.
—
State of Social 2018: The full report
About the State of Social Media survey and data
For this report, we surveyed over 1,700 marketers (1,796 to be precise) from businesses of all sizes. You can view a more detailed breakdown on the data at the bottom of this post.
—
How marketers are using social media platforms: 7 insights you need to know
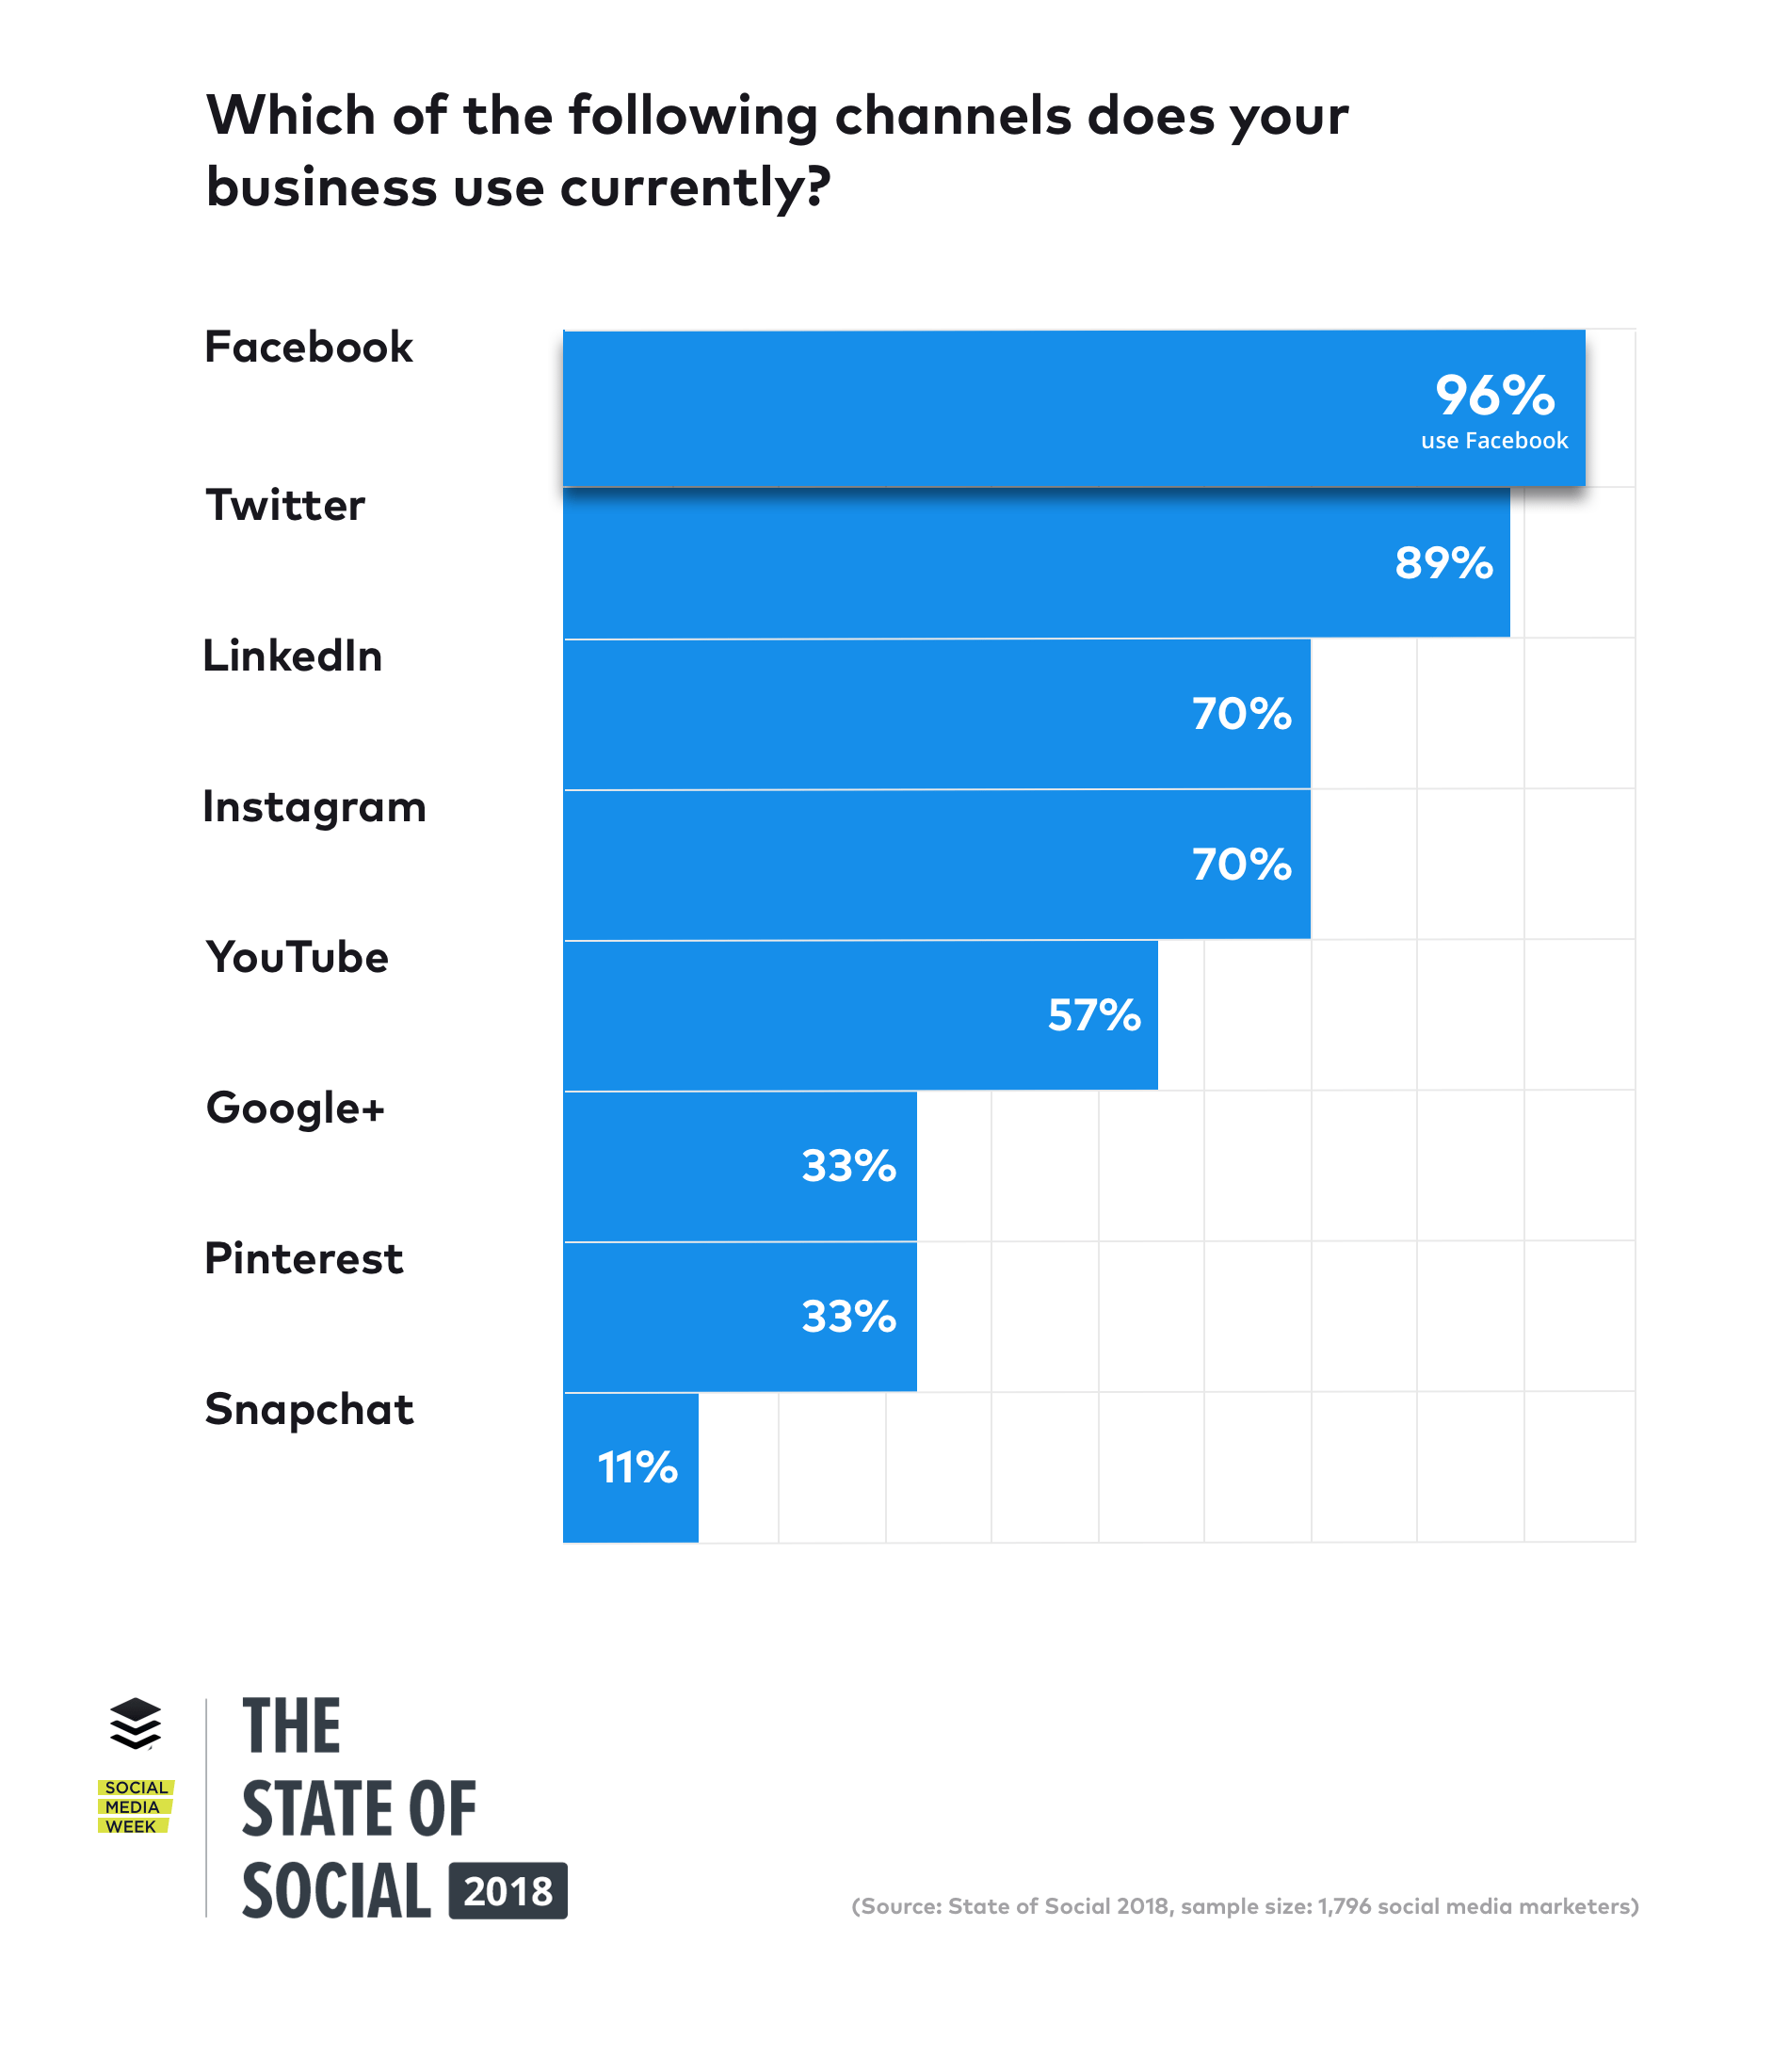
1. Facebook is still the leading platform for marketers (96 percent of businesses use Facebook)
Facebook is the leading platform for marketers with 96 percent saying their business is actively using it. Twitter was close behind with 89 percent of respondents saying they use the platform for their business.
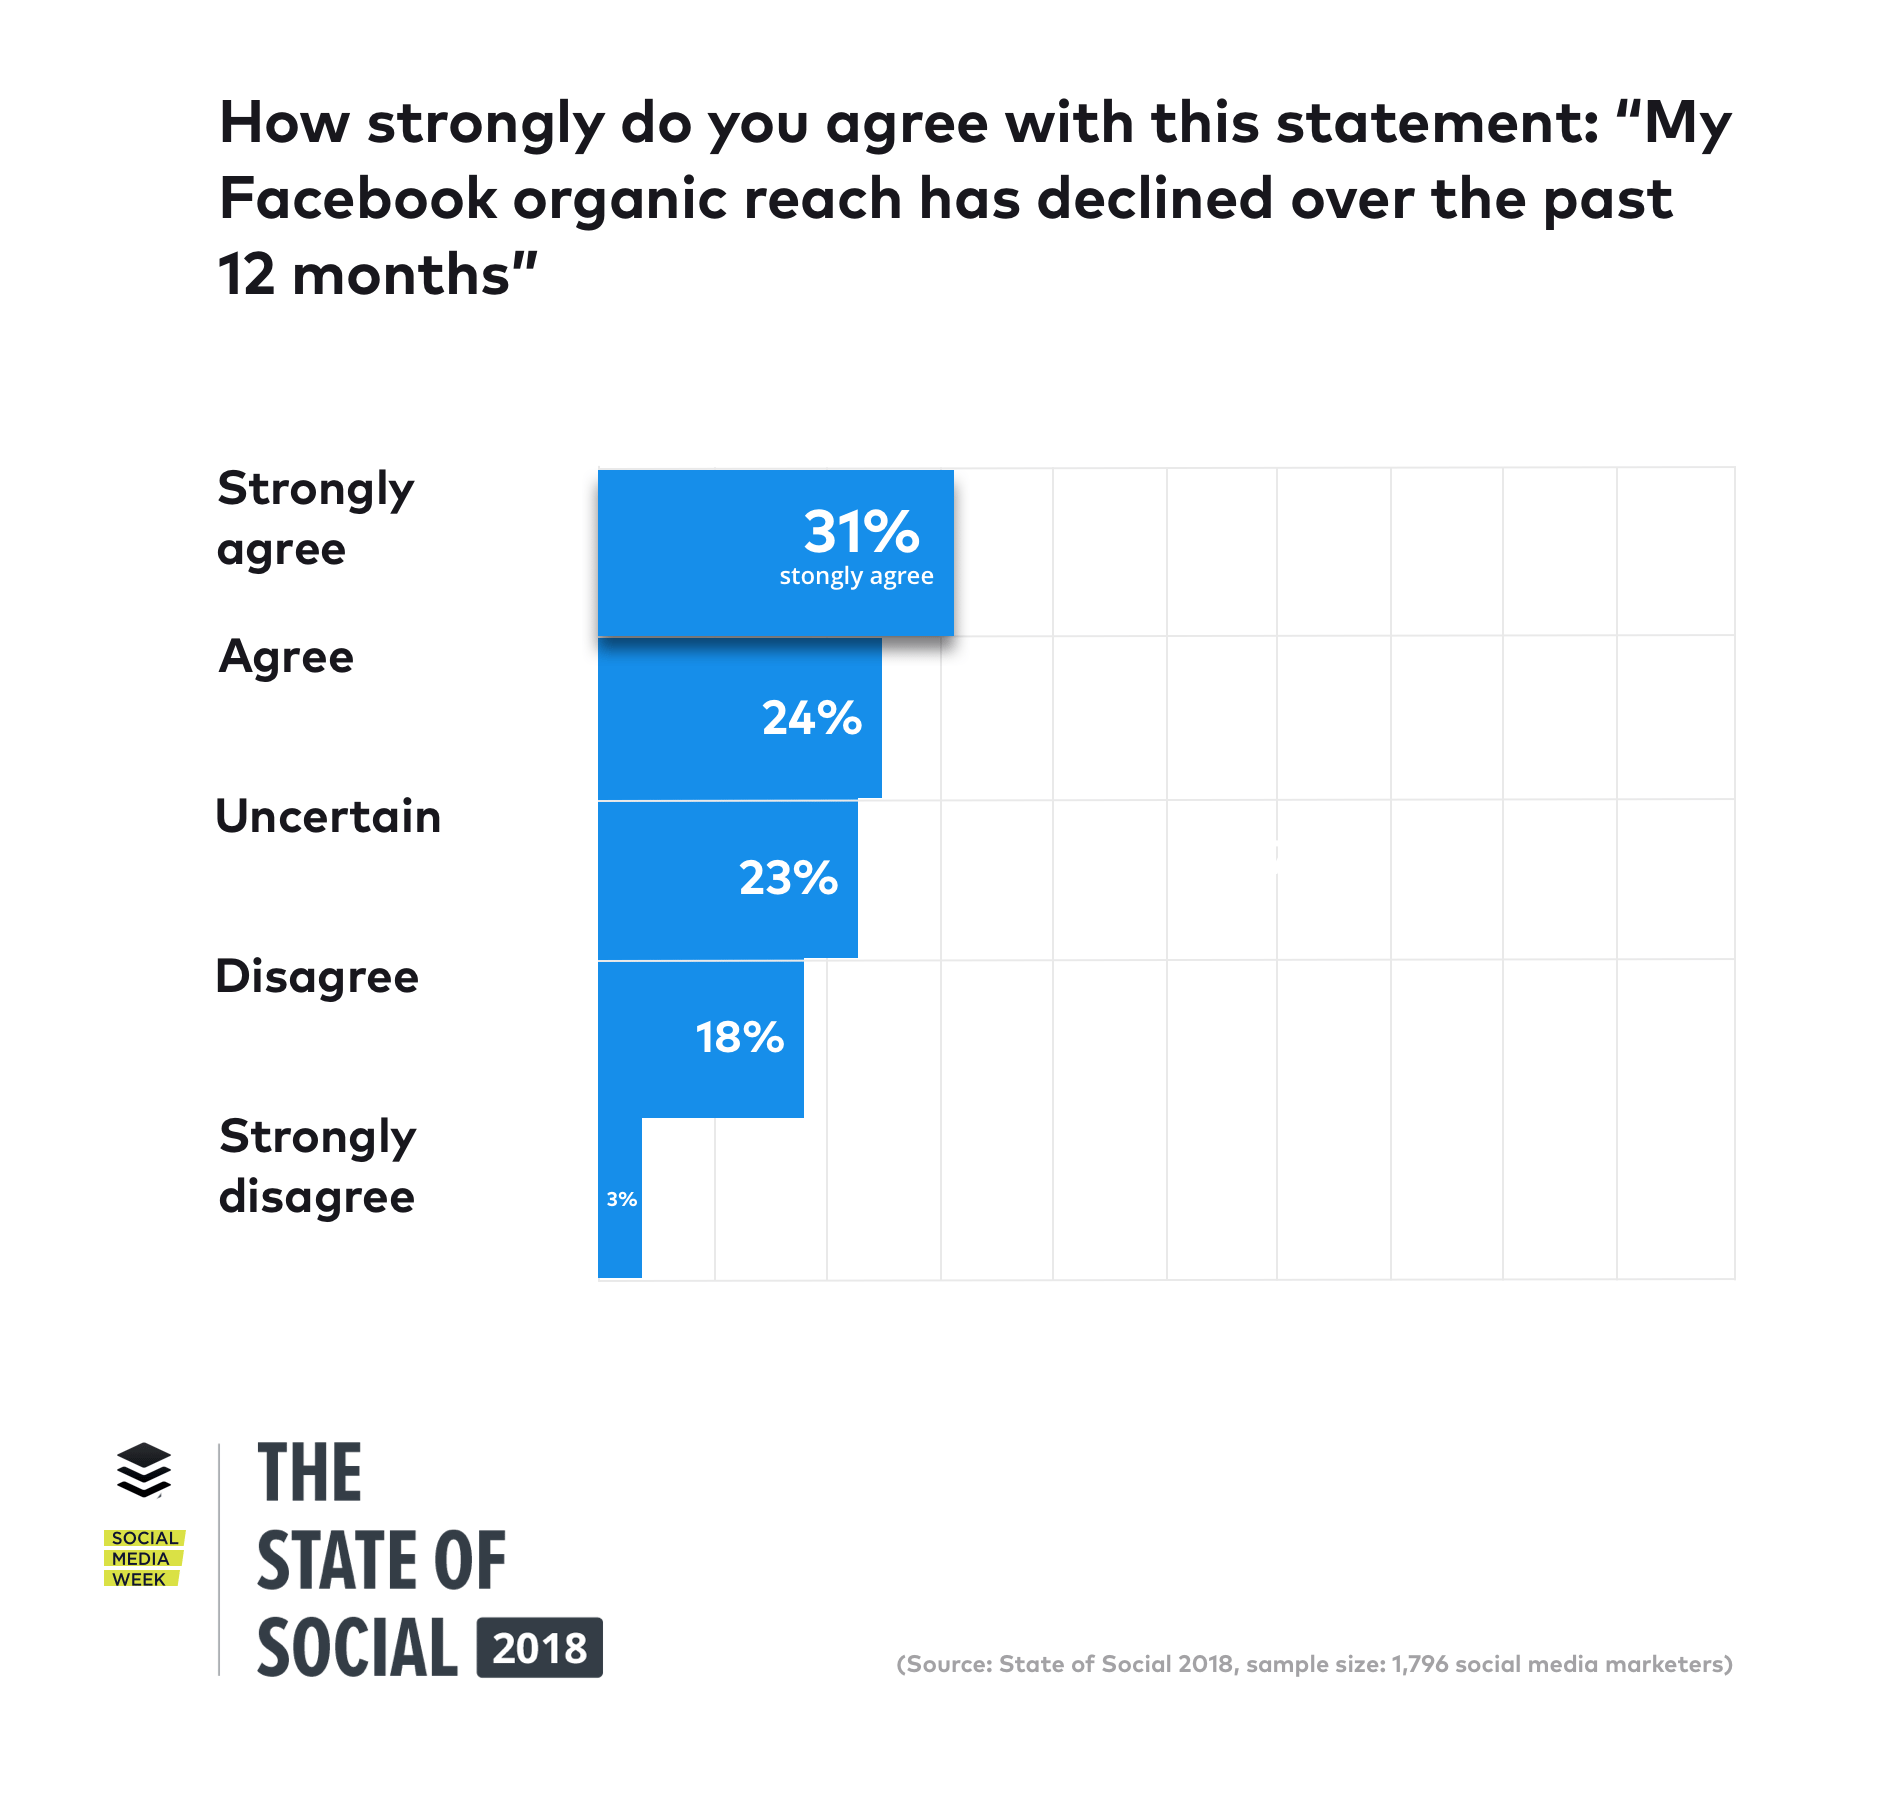
2. Facebook organic reach continues to decline (only 21 percent of respondents haven’t noticed a decline in the past 12 months)
Facebook is constantly tweaking its News Feed algorithm and it appears that organic reach has once again declined over the past 12 months with just 21 percent of people “disagreeing” or “strongly disagreeing” with the below statement:
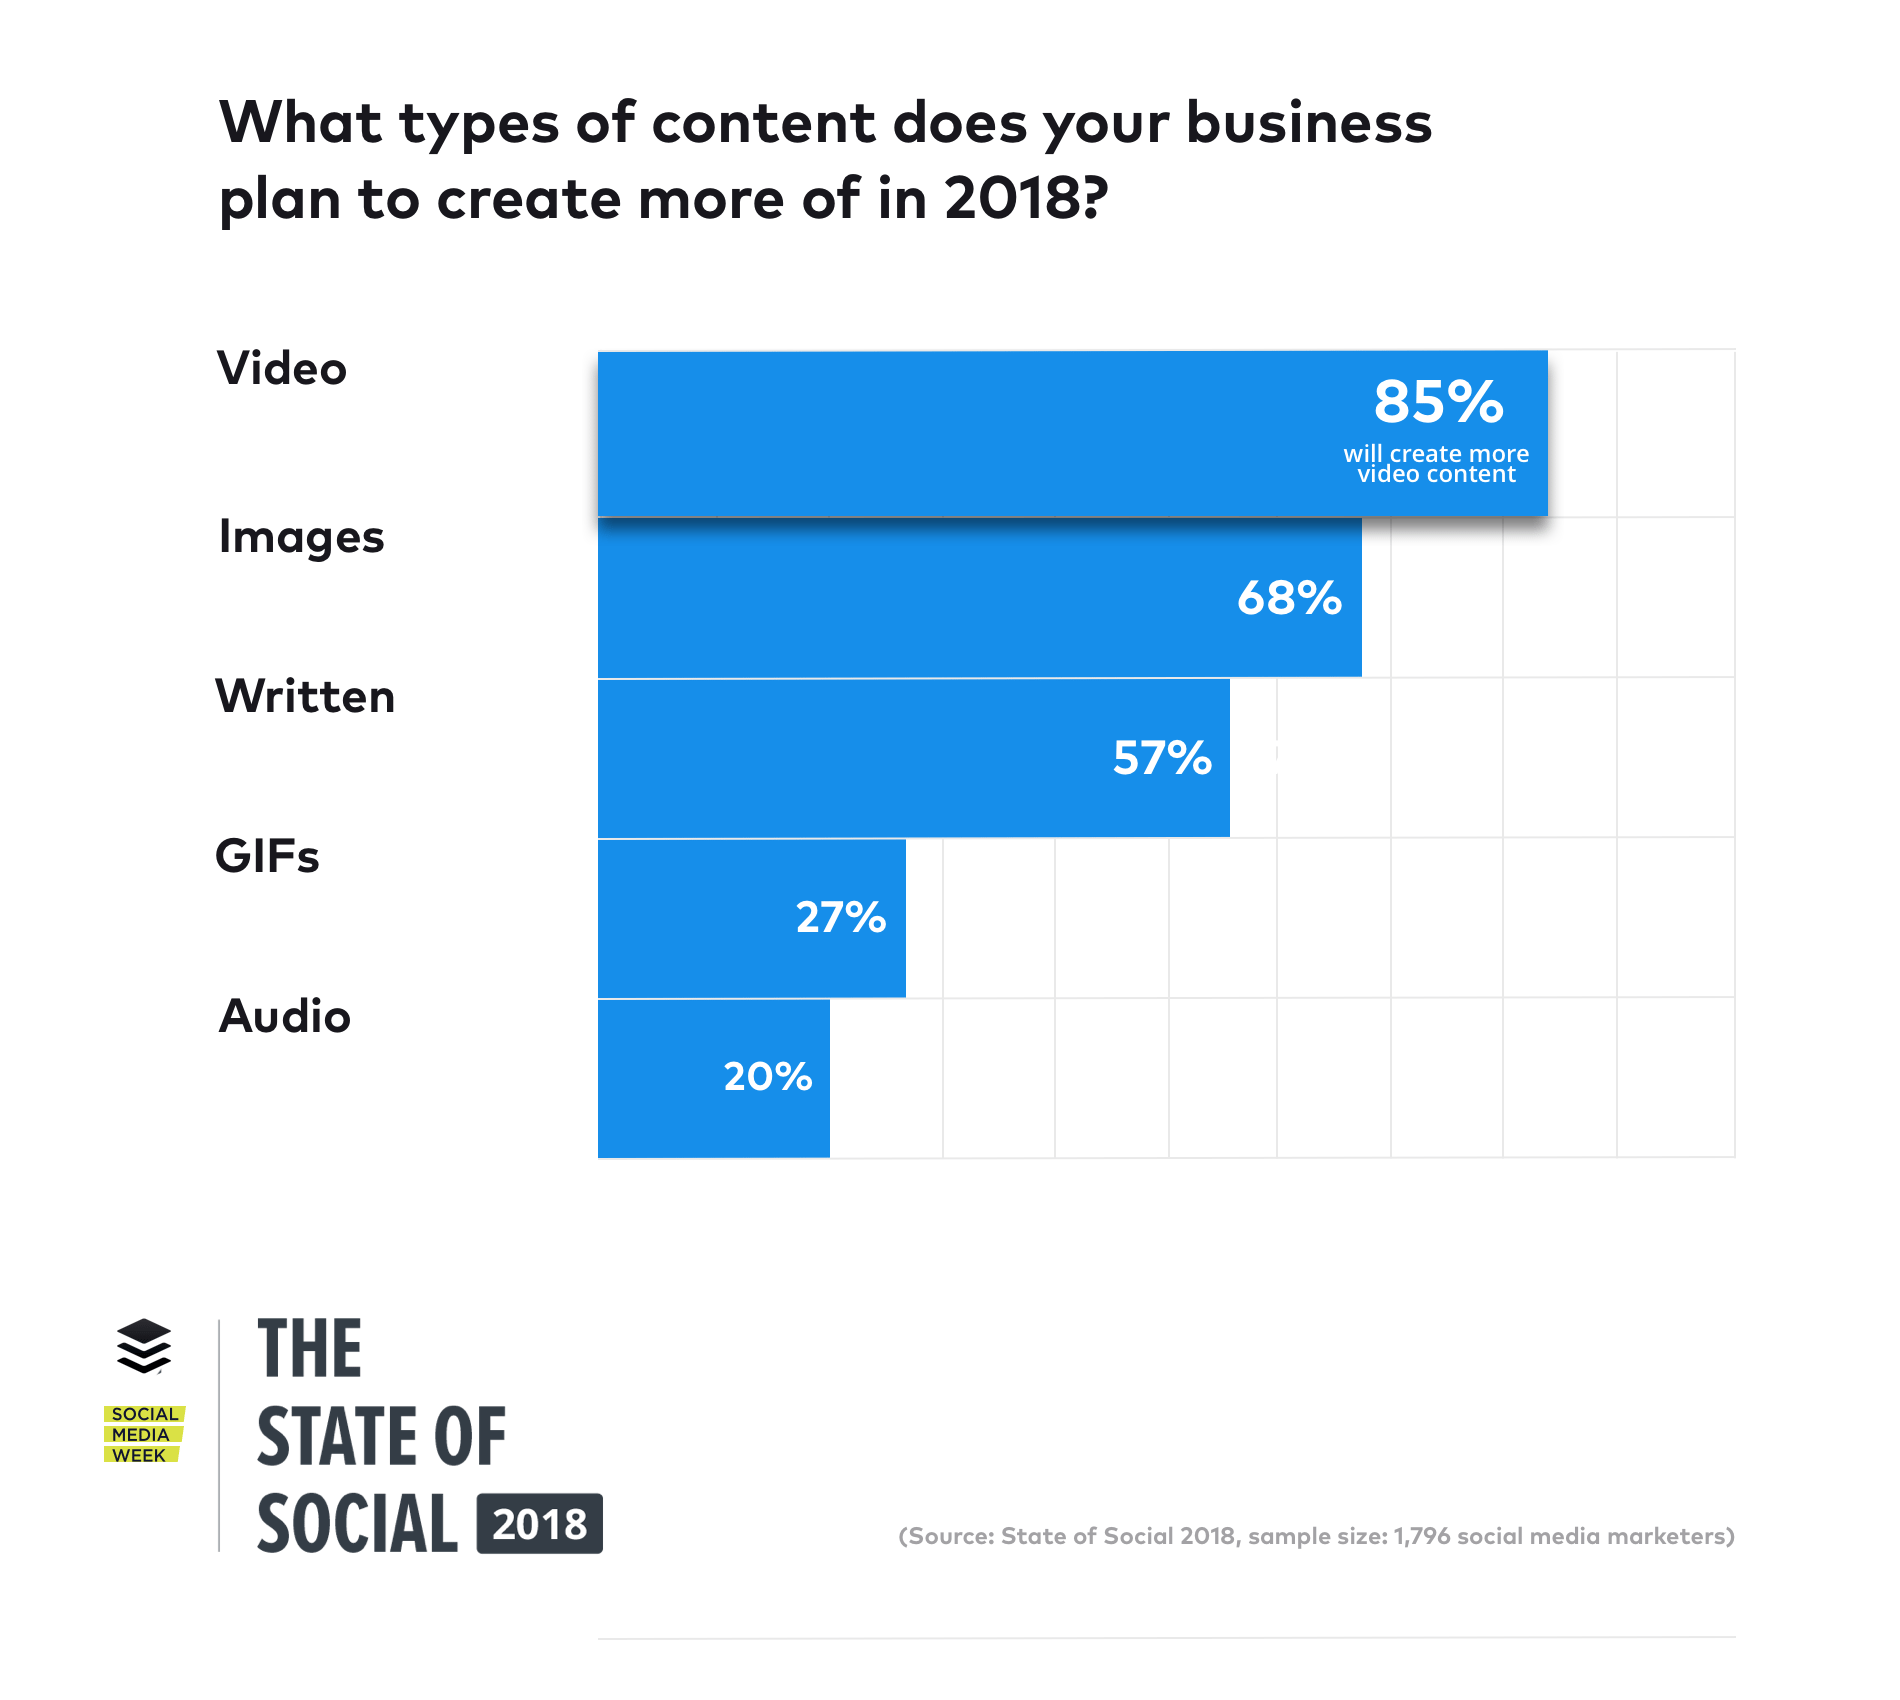
3. Video is a top priority for 2018 (85 percent of businesses would like to create more video content)
Video has been booming across social channels for the past couple of years and 85 percent of businesses are keen to create more video in 2018:
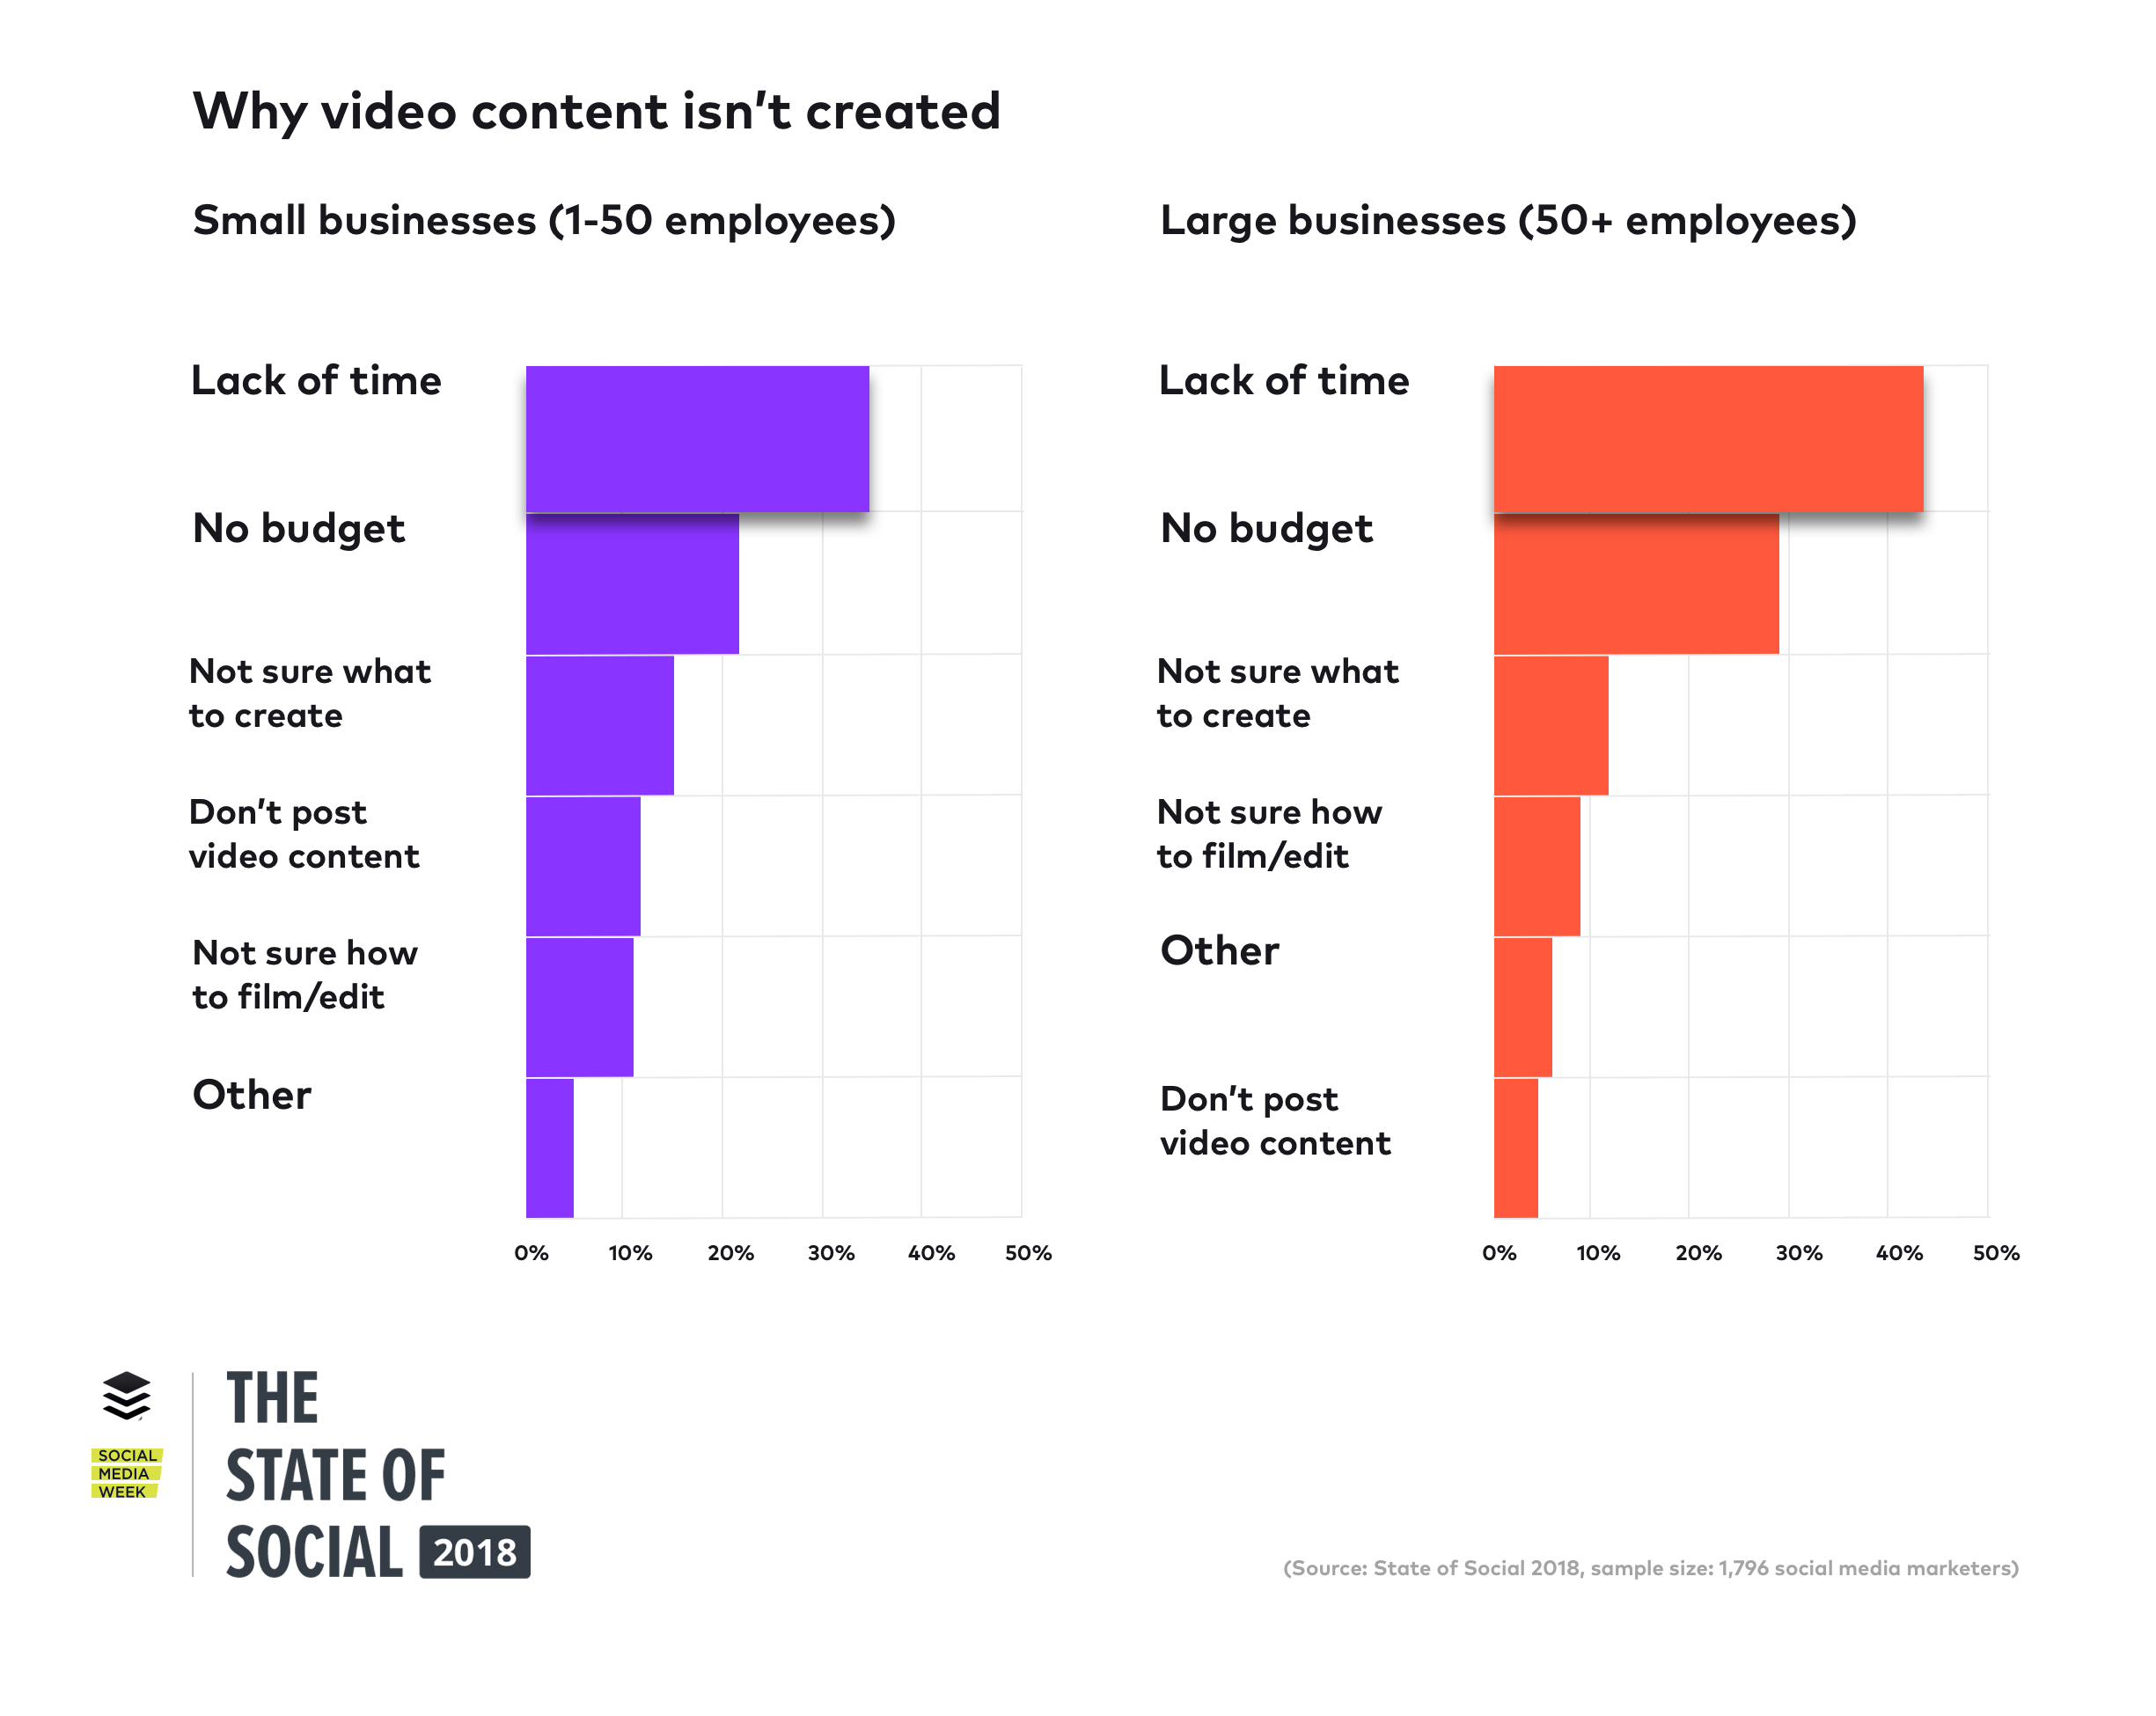
When we asked what’s currently holding businesses back from creating more video content lack of time and budget were the two main blockers:
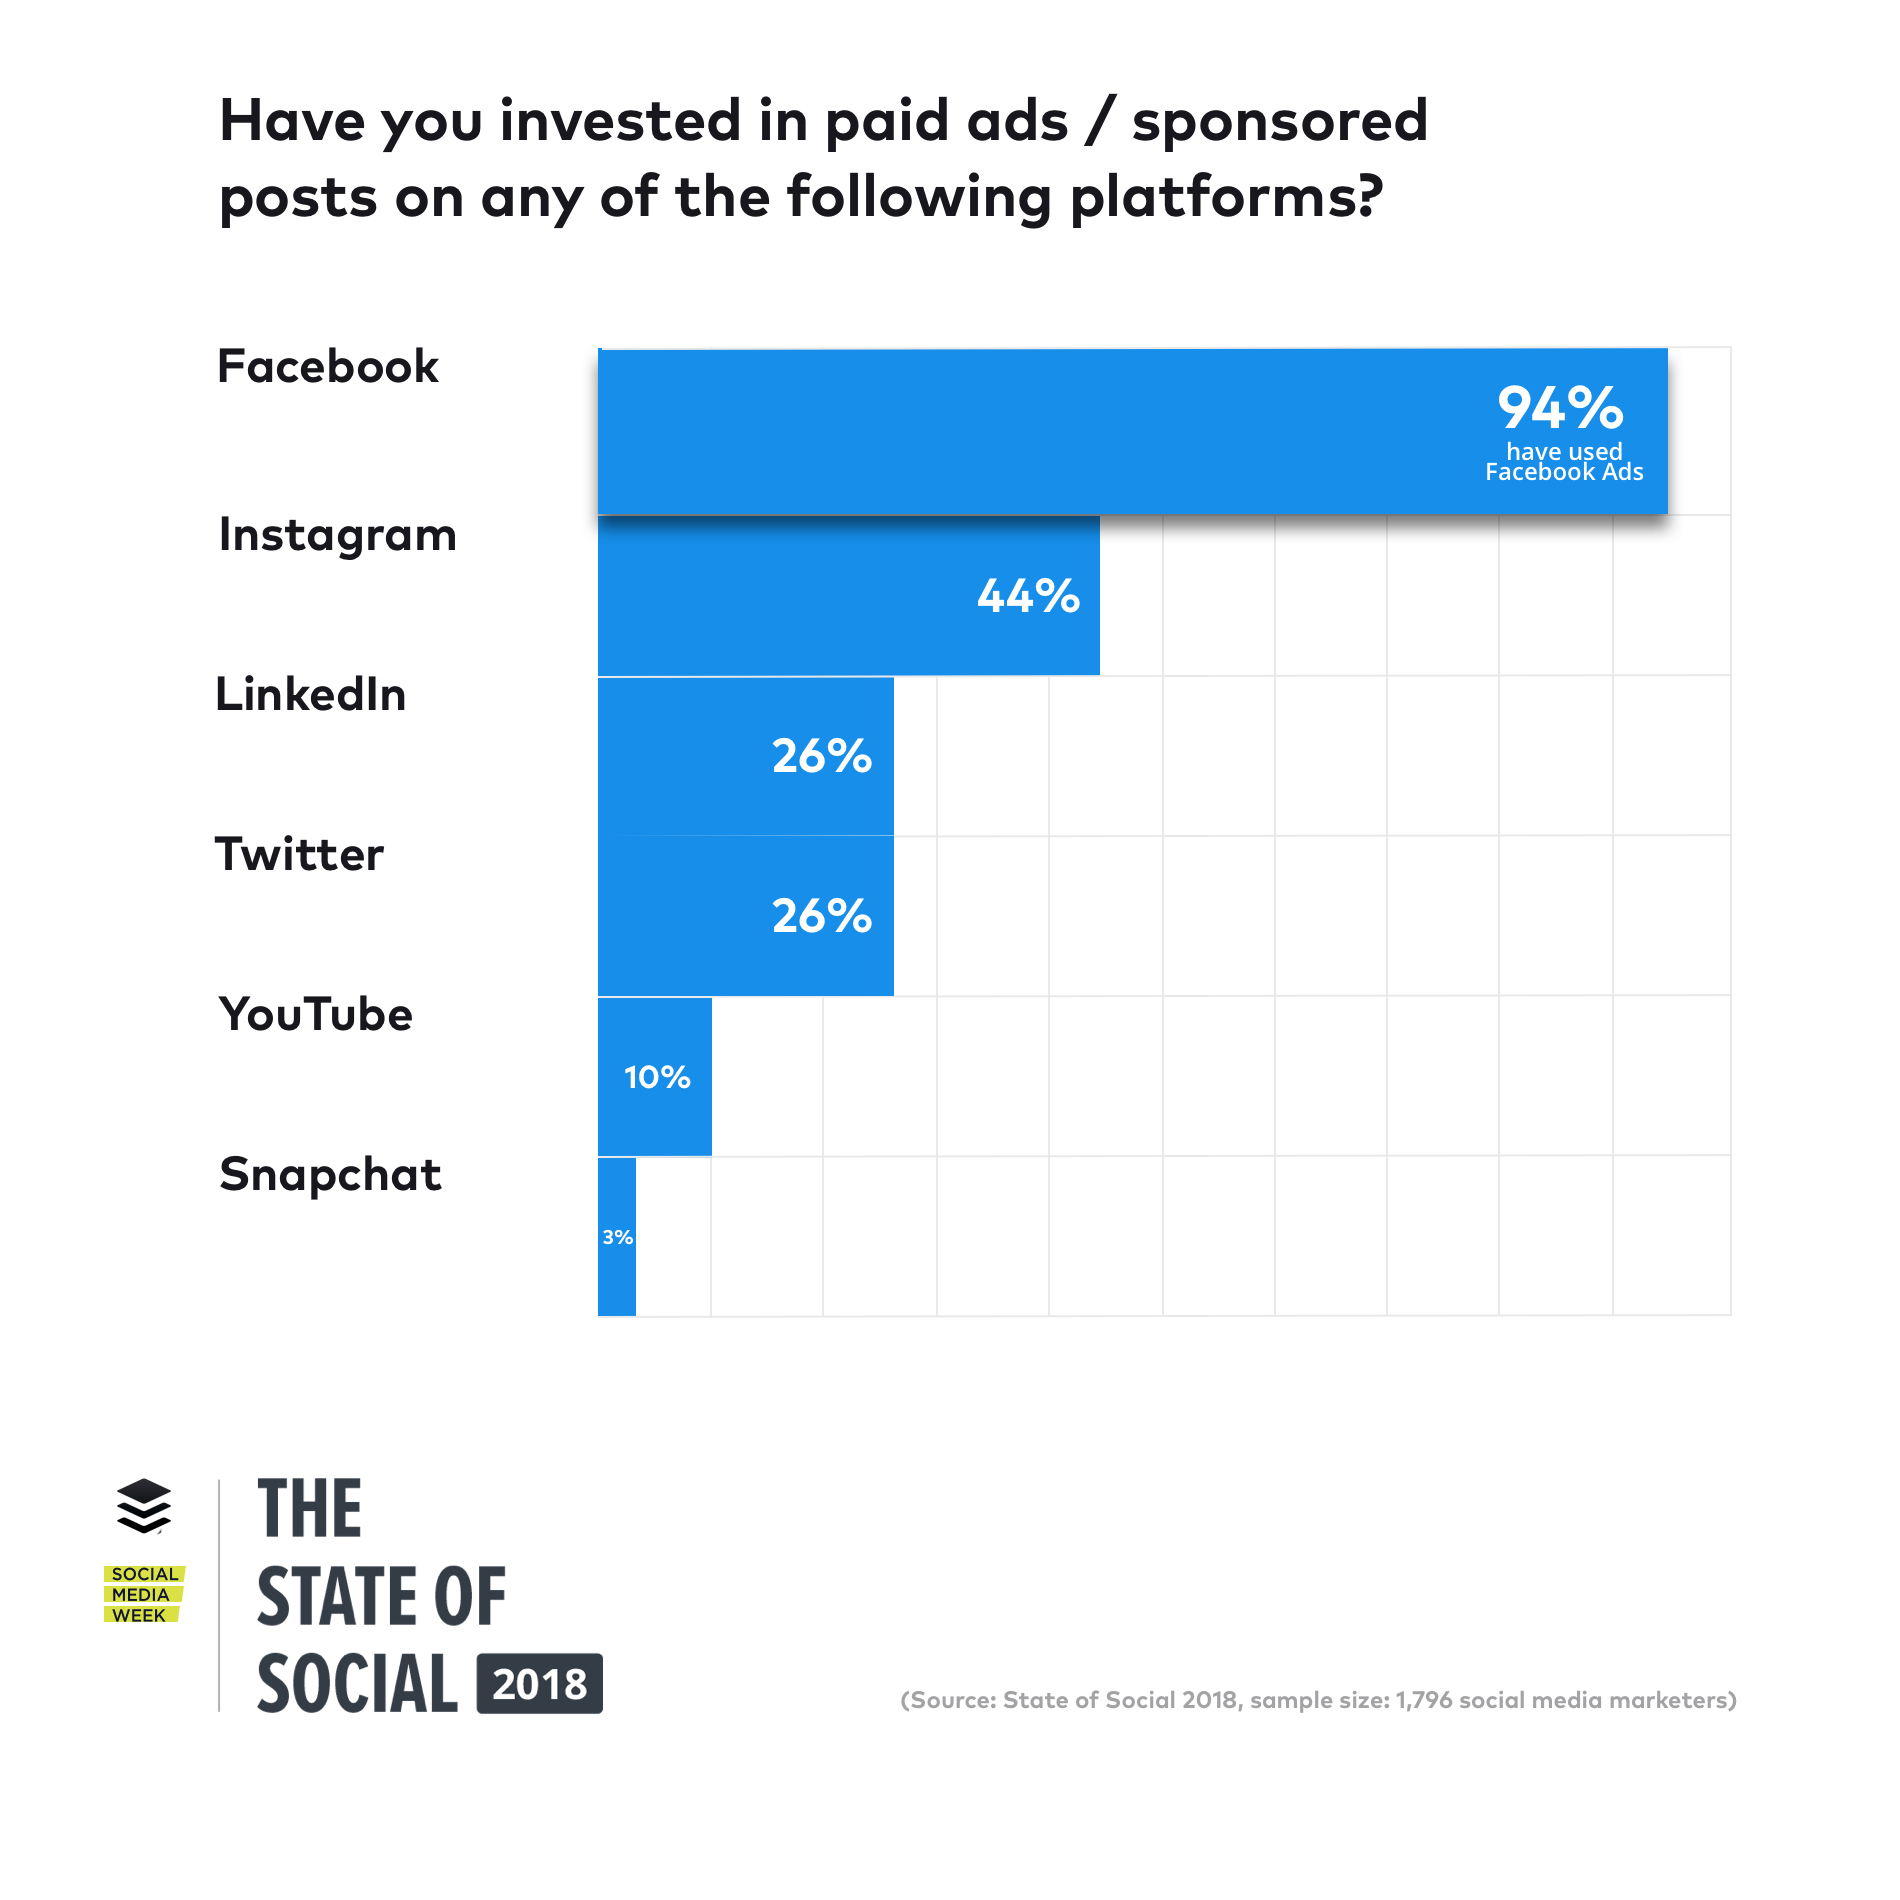
4. Facebook is dominating the paid advertising space (94 percent of marketers have used Facebook Ads)
Facebook is the most popular platform for paid ads (94 percent), followed by Instagram (44 percent), with LinkedIn and Twitter tied in third place (26 percent):
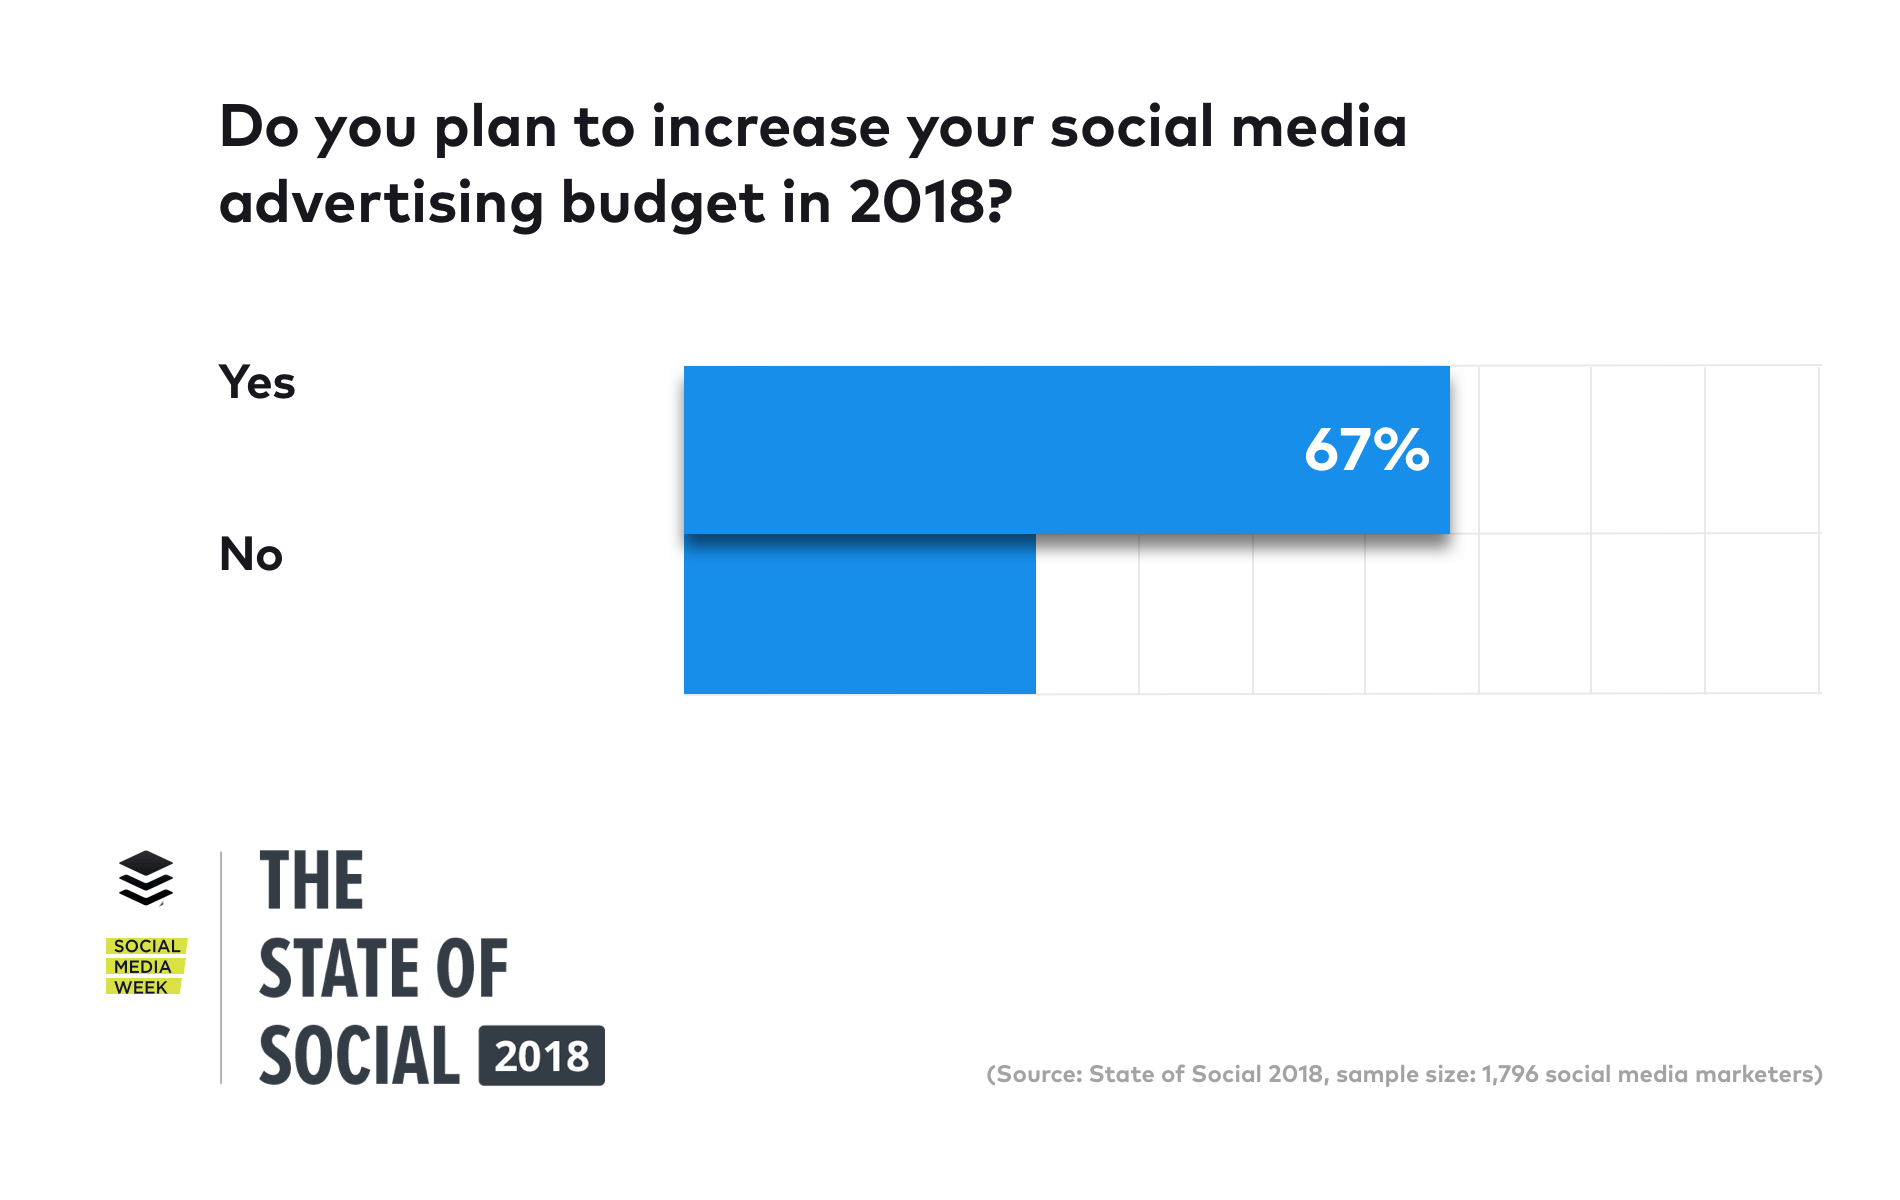
Looking ahead, 67 percent of businesses are looking to increase their social media advertising budget in 2018:
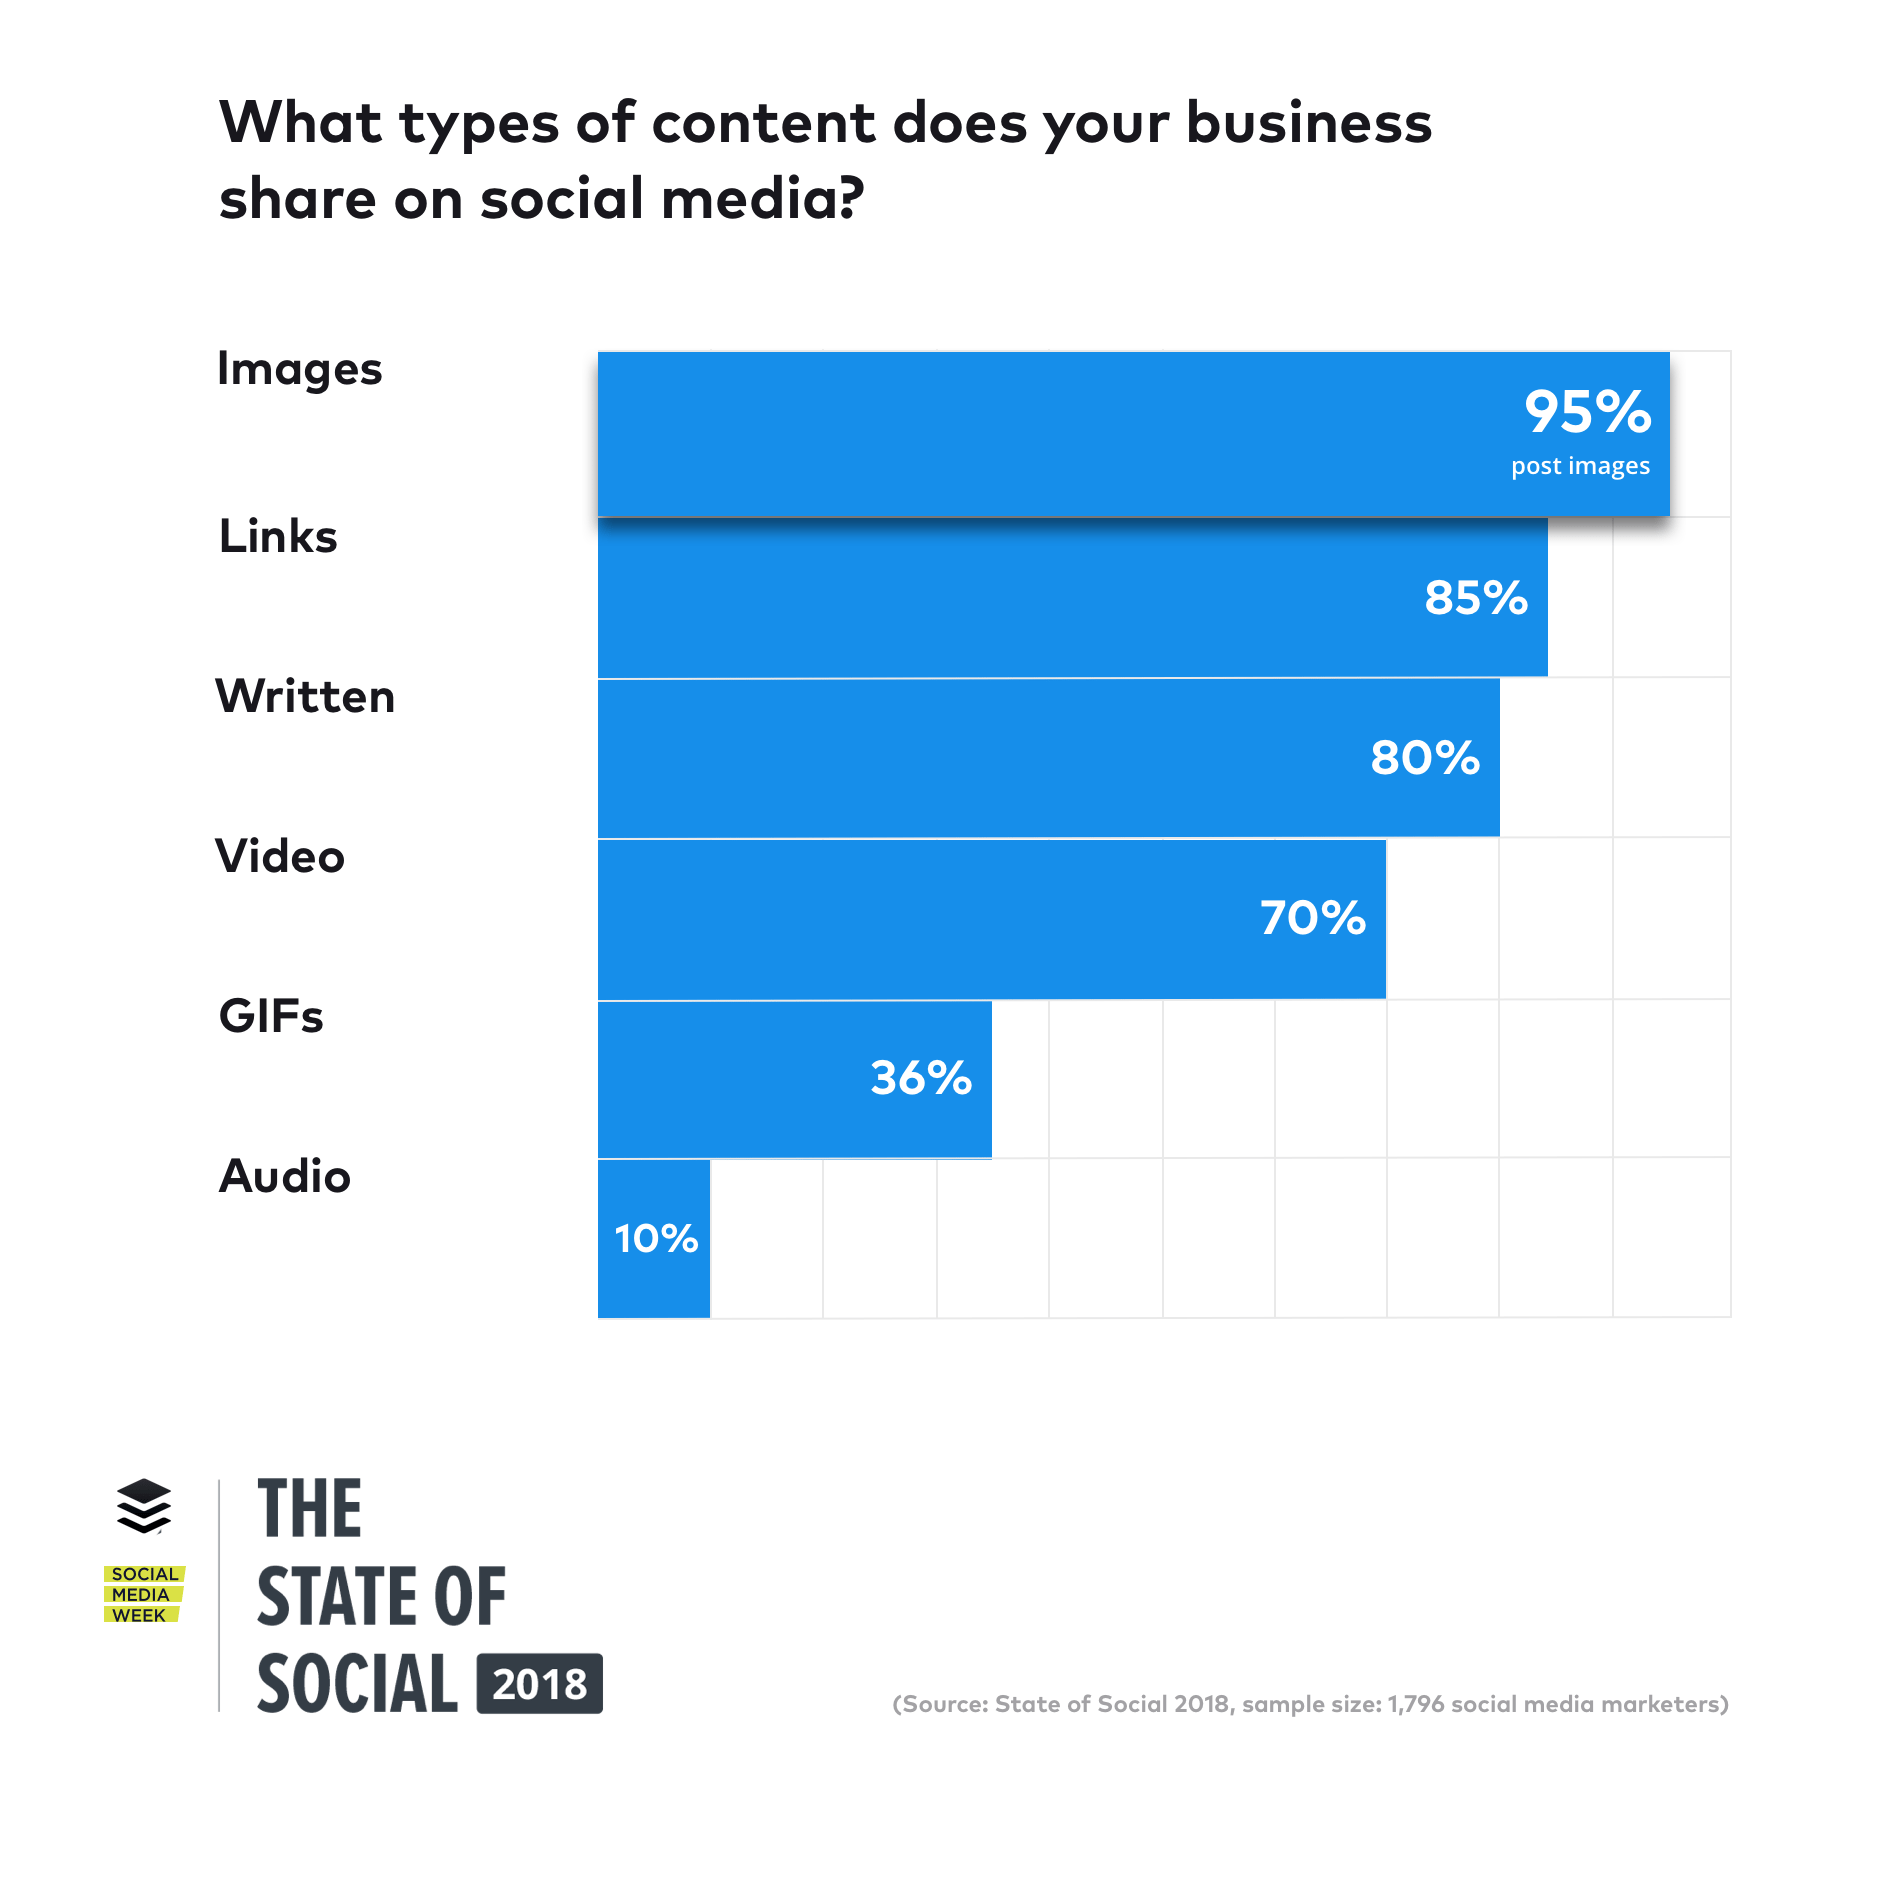
5. Images are the most shared type of content (95 percent of businesses post images to social channels)
Ninty-five percent of respondents said their business posts images, with links (85 percent) being the second most shared content type:
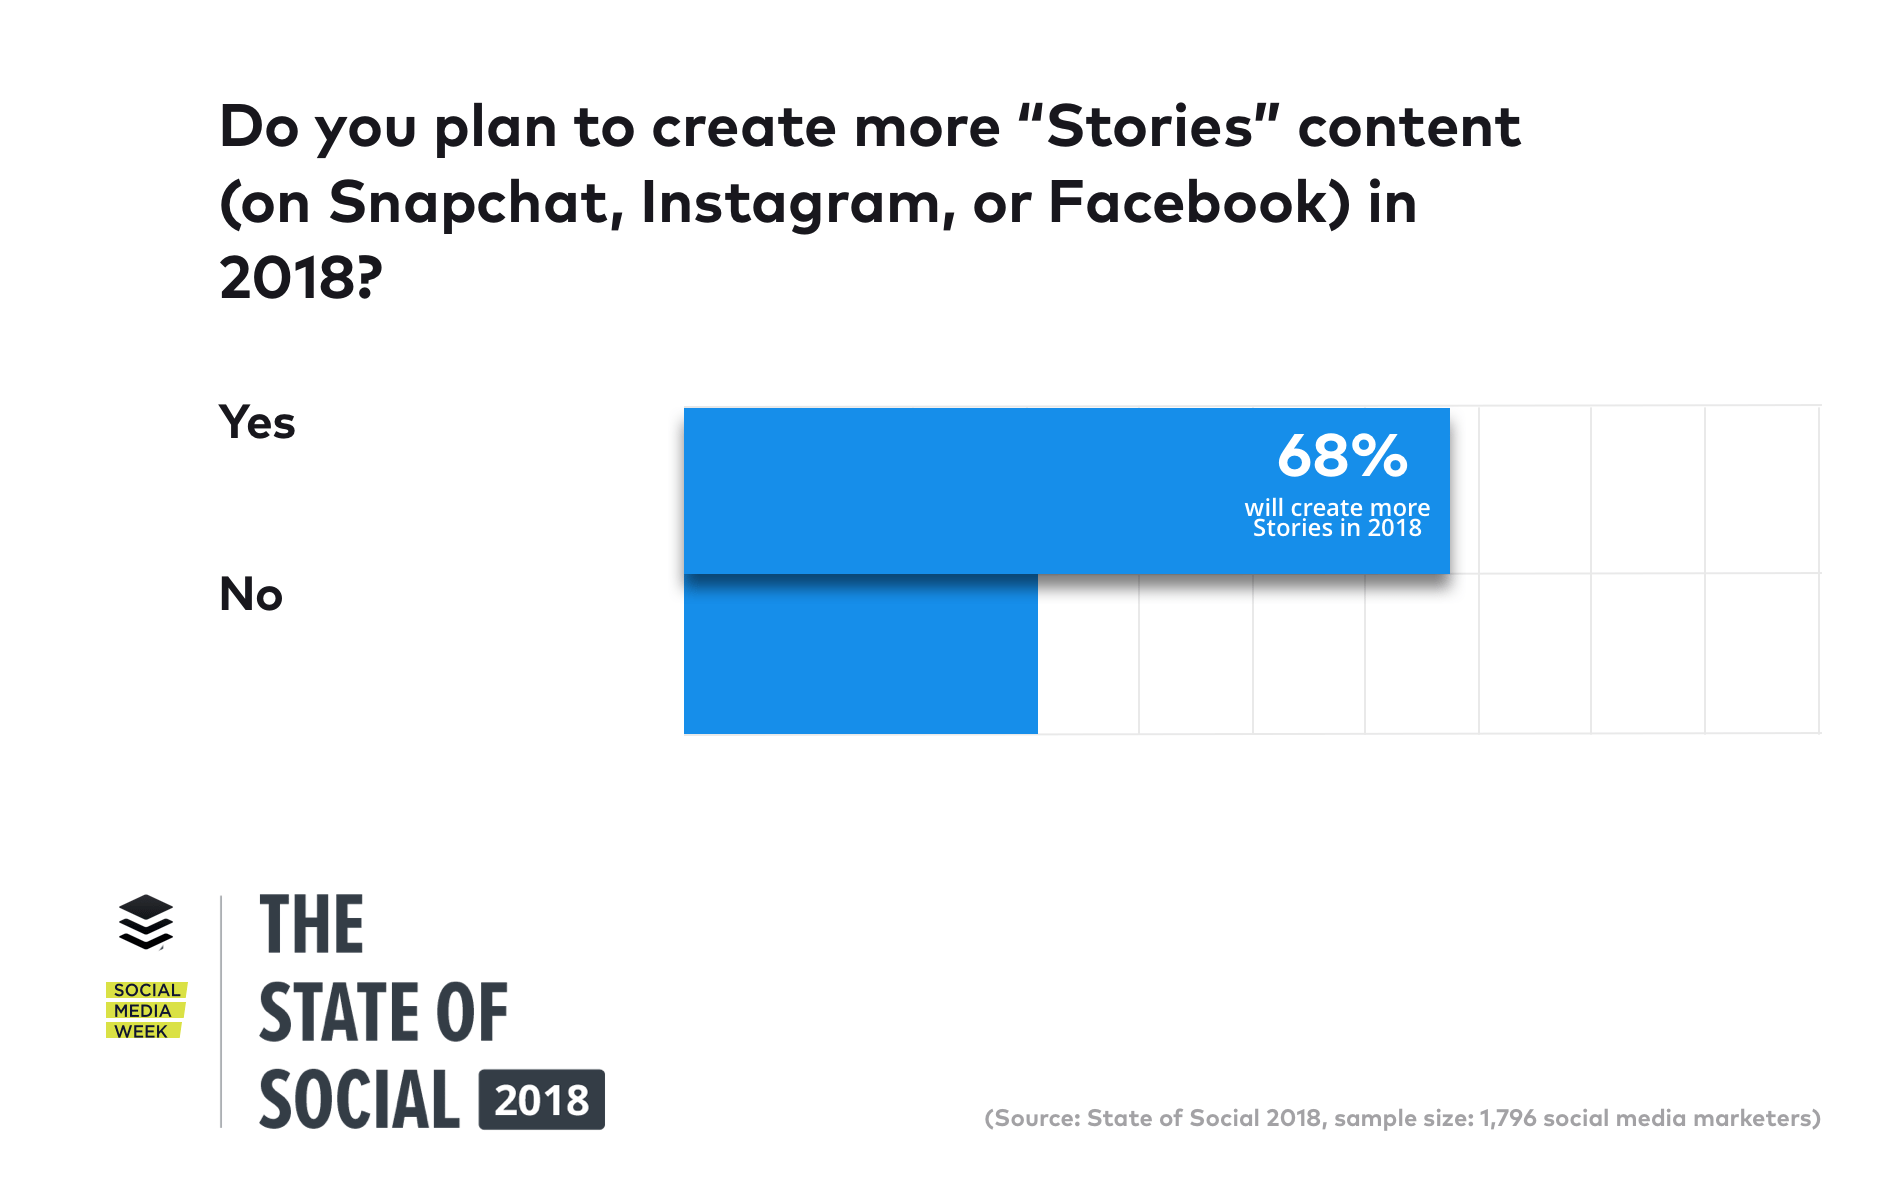
6. The rise of stories (68 percent of marketers are planning on creating more stories in 2018)
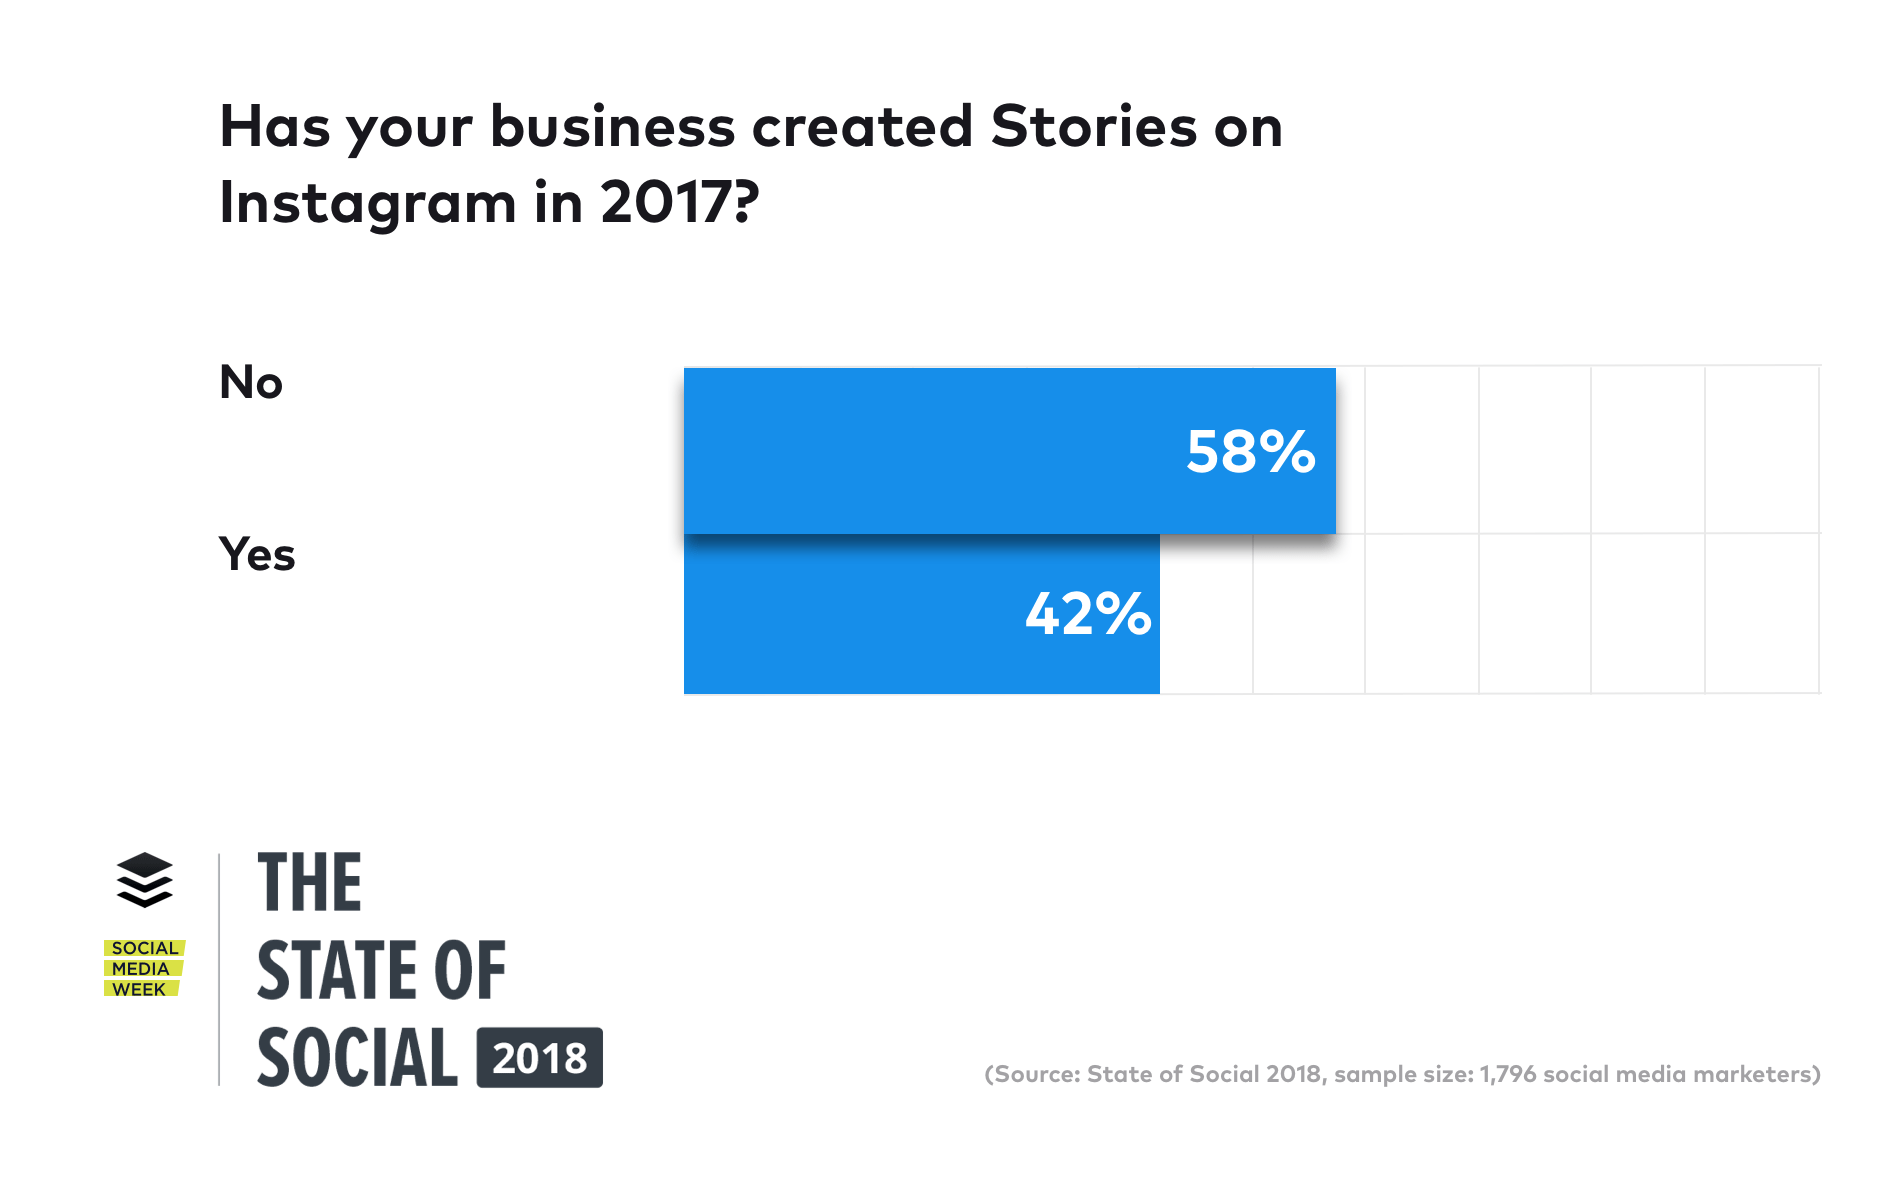
Last year, only 29 percent of State of Social respondents had created stories on Instagram or Snapchat. This year 42 percent have created stories on Instagram (just 11 percent had created stories on Snapchat):
Further to this, 68 percent of respondents plan to create more stories content in 2018:
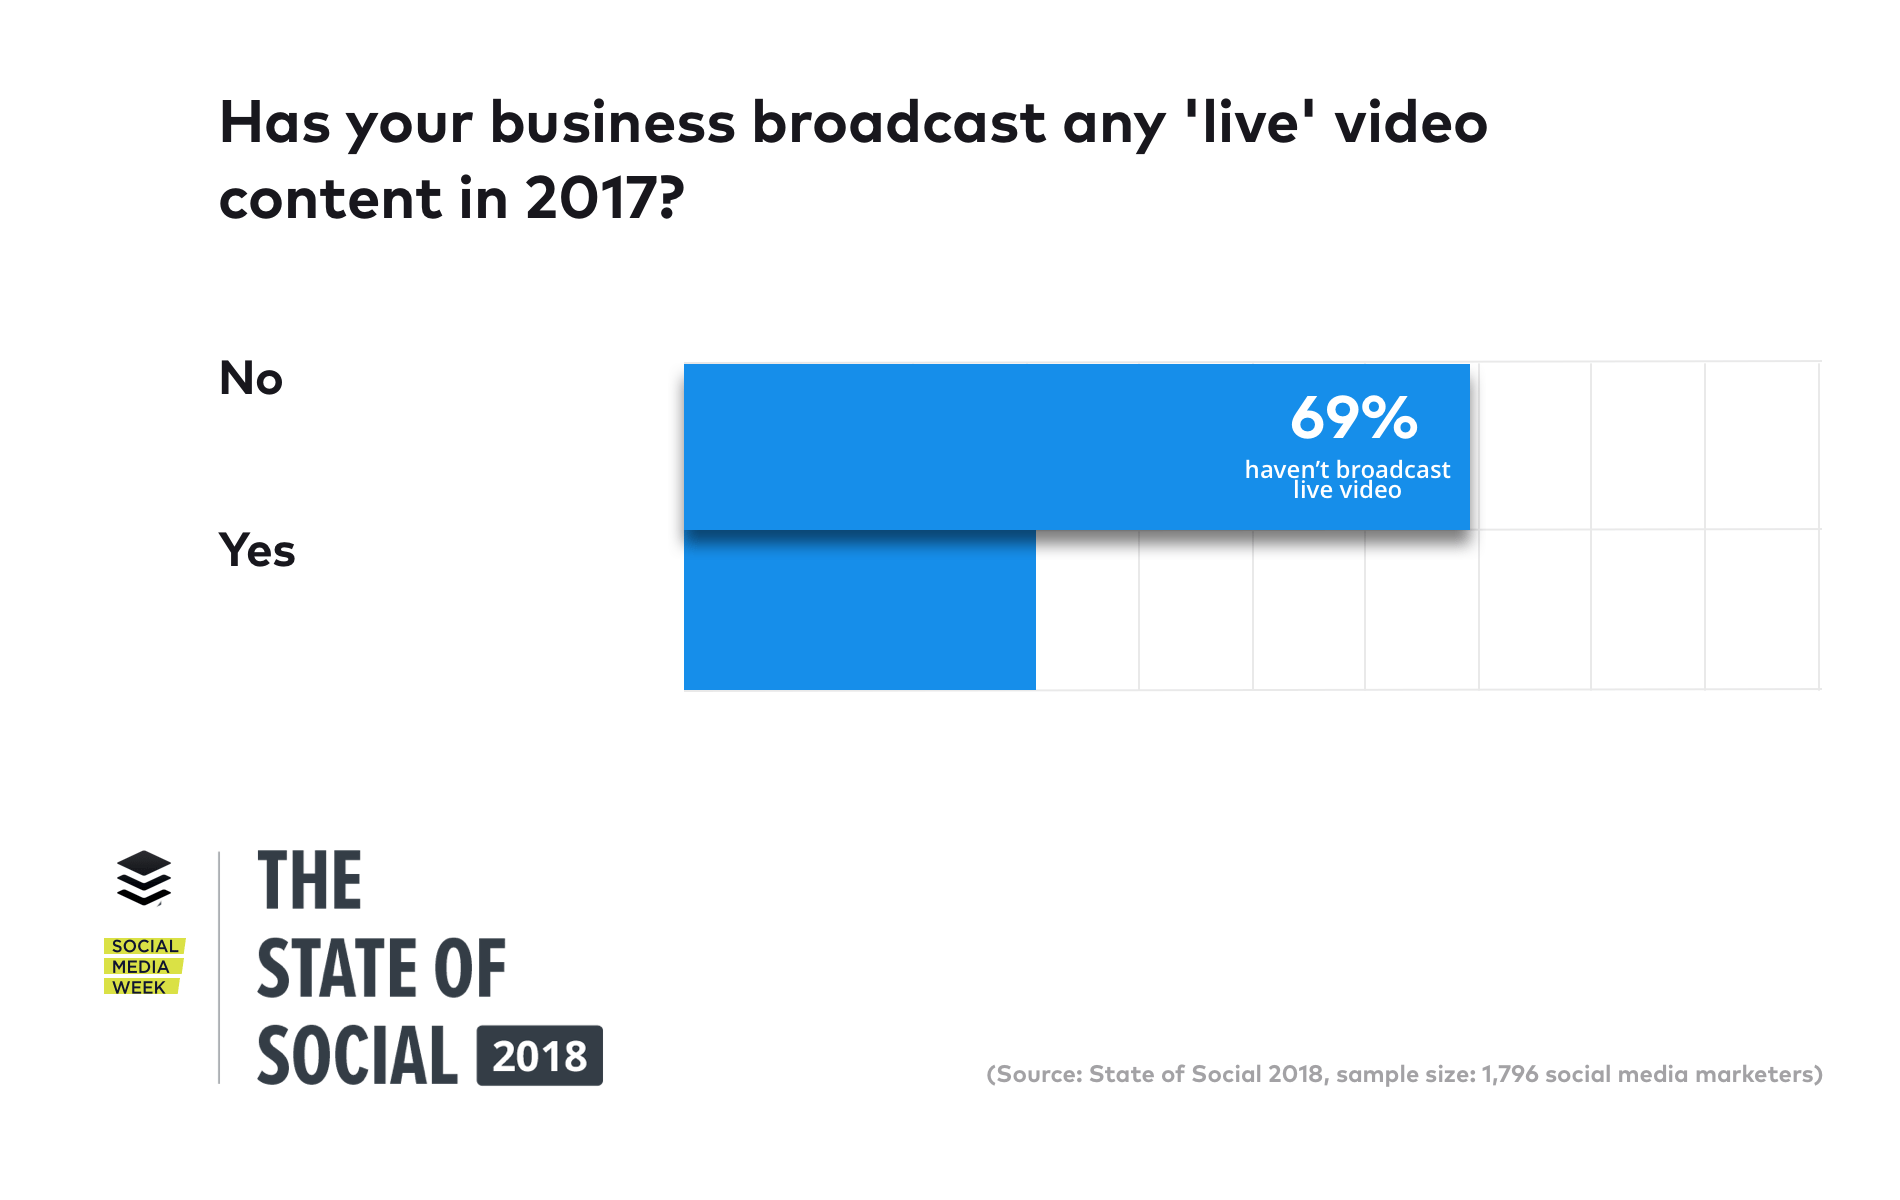
7. Live video hasn’t yet caught on (only 31 percent of marketers have broadcast live video)
In our last State of Social report, 26 percent of marketers said they had created live video content. In 2017, 31 percent of marketers said they had broadcast live content—just a 5 percent increase:
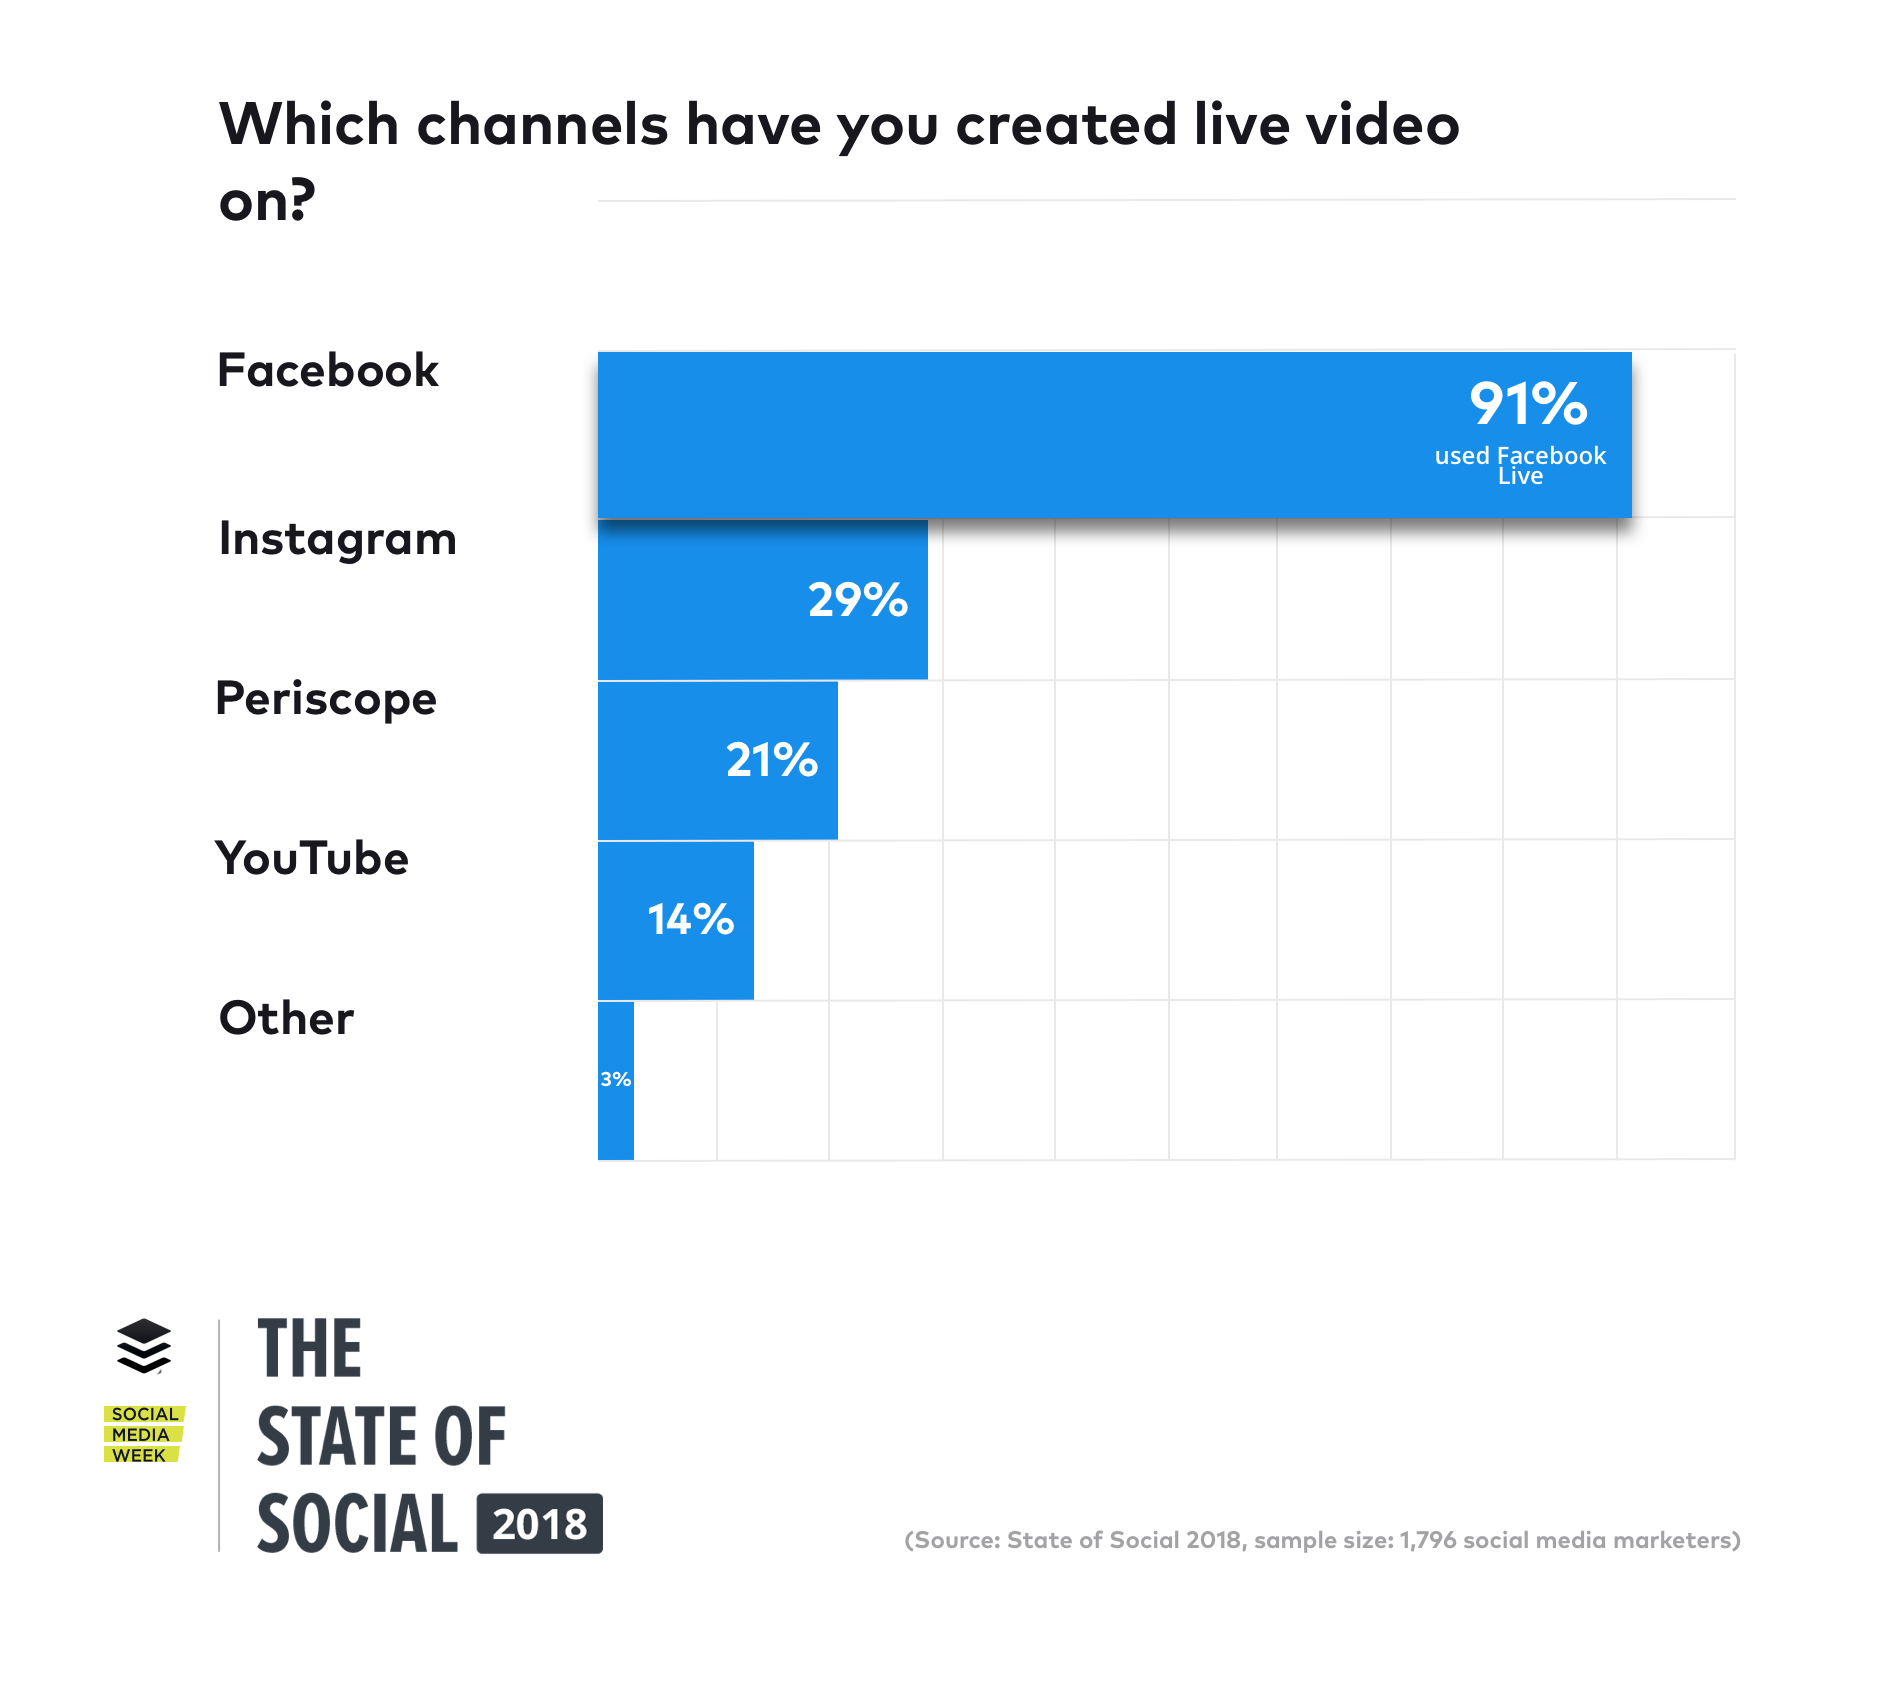
For those who have created live video, Facebook was the number one platform of choice, ahead of Instagram and Periscope (Twitter):
Live video could still present a huge opportunity in 2018, though. Facebook’s Head of News Feed, Adam Mosseri, recently revealed that live videos on average get six times as many interactions as regular videos. This could be especially valuable for Page owners as Facebook is making changes to their News Feed algorithm to give people more opportunities to interact with the people they care about.
Check out the full State of Social 2018 report below
—
The data: Who took part in the survey?
For this report, we surveyed over 1,700 marketers from businesses of all sizes. The majority of respondents work at companies who focus on both B2B and B2C customers (43 percent), while 33 percent work at purely B2B companies and 25 percent at B2C companies. 49 percent of our respondents work at businesses with 1-10 employees. At the other end of the scale, 7 percent of respondents work at companies with over 200 employees.
Company size
Just under half (49 percent) of the people who took our survey work at companies with fewer than 10 full-time staff. A further 21 percent work at companies with between 11-50 full-time team members. Here’s the full breakdown:
- 49 percent: Fewer than 10 people
- 13 percent: 11-25 people
- 8 percent: 26-50 people
- 8 percent: 1,001+ people
- 7 percent: 51-100 people
- 6 percent: 101-200 people
- 5 percent: 201-500 people
- 4 percent: 501-1,000 people
Marketing team size
The majority of respondents in our survey work closely with a small number of colleagues in their marketing teams or act as the sole marketer at their company:
- 41 percent of respondents were the only marketer at their company
- 38 percent of people worked in marketing teams of between 2-5 colleagues
- 11 percent of people work in marketing teams larger than 11 people
- 9 percent of people work in marketing teams of between 6-10
Industry breakdown
Twenty-three percent of those who took the survey work at organizations in the marketing, PR, and advertising space. Other industries include: Media and Publishing (11 percent); Non-Profit (10 percent); Education (8 percent); Consumer Products (8 percent); IT & Services (6 percent); Software (5 percent); E-commerce (3 percent); Medical & Healthcare (3 percent); Financial (3 percent); Travel & Tourism (2 percent); Financial Services (2 percent); Government (2 percent); Law & Legal Services (1 percent); Other (15 percent).
—
Over to you
Thanks so much for checking out our State of Social 2018 report. We hope you enjoyed the data and discovered some useful takeaways for your business.
P.S. We’ve made the data open and available to anyone in this Google Sheet (feel free to make a copy and interrogate in any way you’d like – we’d love to hear what you might find). You can also download a copy of all the State of Social 2018 charts here.
Feature image via Jaelynn Castillo.
Try Buffer for free
140,000+ small businesses like yours use Buffer to build their brand on social media every month
Get started nowRelated Articles

In this article, Nupur Mittal shares insights into four research methods that help her find content ideas and identify unique takeaways.
Facebook marketing in 2019 isn’t dead. On the contrary, it’s far from it. Now removed from the dim outlook that businesses faced at the beginning of 2018, Facebook has and will remain an essential tool for brands’ marketing strategies moving forward. In our big State of Social Media 2019 Report, we found that 93.7 percent of businesses use and are currently active on Facebook — the most among any other social media network. And although we continue to see a dramatic rise in the usage